HomeAdministrative Division
Tweet
Facebook
Show Map

Kilinochchi

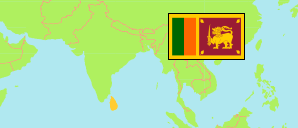
District in Sri Lanka

Contents: Population

The population development of Kilinochchi as well as related information and services (Wikipedia, Google, images).

KilinochchiDistrict91,764127,263113,510136,434
Sri LankaRepublic14,846,75018,797,25720,359,43921,763,170

Source: Department of Census and Statistics, Sri Lanka.

Explanation: The results of the 2024 census are provisional.


Further information about the population structure:

MalesFemales48.9%51.1%
GenderPersons
Males65,000
Females68,000
Gender (E 2021)
Males65,000
Females68,000
Rural100%
UrbanizationPersons
Rural113,510
Urbanization (C 2012)
Rural113,510
0-14 years15-64years65+ years32.5%62.5%
Age GroupsPersons
0-14 years36,853
15-64 years70,969
65+ years5,688
Age Groups (C 2012)
0-14 years36,853
15-64 years70,969
65+ years5,688
0-9 years10-19 years20-29 years30-39 years40-49 years50-59 years60-69 years70-79 years80+ years
Age DistributionPersons
0-9 years25,201
10-19 years22,947
20-29 years17,797
30-39 years17,077
40-49 years11,217
50-59 years9,302
60-69 years6,855
70-79 years2,527
80+ years587
Age Distribution (C 2012)
0-9 years25,201
10-19 years22,947
20-29 years17,797
30-39 years17,077
40-49 years11,217
50-59 years9,302
60-69 years6,855
70-79 years2,527
80+ years587
SinhaleseTamilSri LankanMoorOther98.3%
Ethnic GroupPersons
Sinhalese1,331
Tamil111,524
Sri Lankan Moor629
Other ethnic group26
Ethnic Group (C 2012)
Sinhalese1,331
Tamil111,524
Sri Lankan Moor629
Other ethnic group26
BuddhistHinduMuslimChristianOther81.9%
ReligionPersons
Buddhist1,275
Hindu92,986
Muslim700
Christian18,499
Other religion50
Religion (C 2012)
Buddhist1,275
Hindu92,986
Muslim700
Christian18,499
Other religion50
in thesamedistrictelsewhere33.9%66.1%
Place of BirthPersons
in the same district75,082
elsewhere38,428
Place of Birth (C 2012)
in the same district75,082
elsewhere38,428

See also:

Located in:

The service has to support the EPSG:3857 projection; in case of WMTS as TileMatrixSet name.


5 km
Toggle Menu
Zoom In
Zoom Out
Population
Density
Change
Gender
Age 65+
Urbanization
Status
Change Label
Enlarge Map
Downsize Map
Hide Map
Toggle Menu
Change Base Map
Change Transparency
Undock Map
Swap Map Position
Enlarge Map
Downsize Map
Show Legend
Print Map