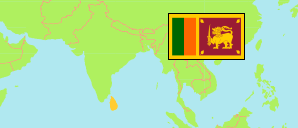
Eastern
Province in Sri Lanka
Contents: Subdivision
The population development in Eastern as well as related information and services (Wikipedia, Google, images).
| Name | Status | Population Census 1981-03-17 | Population Census 2001-07-17 | Population Census 2012-03-20 | Population Census 2024-12-19 | |
|---|---|---|---|---|---|---|
| Eastern (Kilakku, Negenahira) | Province | 975,251 | 1,419,602 | 1,555,510 | 1,782,050 | |
| Ampara | District | 388,970 | 592,997 | 649,402 | 744,150 | → |
| Batticaloa | District | 330,333 | 486,447 | 526,567 | 595,435 | → |
| Trincomalee | District | 255,948 | 340,158 | 379,541 | 442,465 | → |
| Sri Lanka | Republic | 14,846,750 | 18,797,257 | 20,359,439 | 21,763,170 |
Source: Department of Census and Statistics, Sri Lanka.
Explanation: The results of the 2024 census are provisional.
Further information about the population structure:
| Gender (E 2021) | |
|---|---|
| Males | 863,000 |
| Females | 920,000 |
| Urbanization (C 2012) | |
|---|---|
| Rural | 1,165,823 |
| Urban | 389,687 |
| Age Groups (C 2012) | |
|---|---|
| 0-14 years | 472,373 |
| 15-64 years | 1,010,175 |
| 65+ years | 72,962 |
| Age Distribution (C 2012) | |
|---|---|
| 0-9 years | 318,428 |
| 10-19 years | 308,058 |
| 20-29 years | 251,413 |
| 30-39 years | 226,227 |
| 40-49 years | 186,174 |
| 50-59 years | 143,145 |
| 60-69 years | 80,996 |
| 70-79 years | 31,828 |
| 80+ years | 9,241 |
| Ethnic Group (C 2012) | |
|---|---|
| Sinhalese | 360,738 |
| Tamil | 614,184 |
| Sri Lankan Moor | 574,327 |
| Other ethnic group | 6,261 |
| Religion (C 2012) | |
|---|---|
| Buddhists | 357,052 |
| Hindus | 540,153 |
| Muslims | 575,470 |
| Christians | 82,683 |
| Other religion | 152 |
| Place of Birth (C 2012) | |
|---|---|
| in the same district | 1,392,299 |
| elsewhere | 163,211 |
