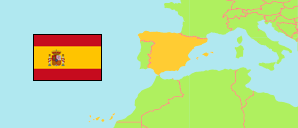
Lagunilla
in Salamanca (Castilla y León)
Contents: Municipality
The population development of Lagunilla as well as related information and services (weather, Wikipedia, Google, images).
| Name | Province | Population Census 1981-03-01 | Population Census 1991-03-01 | Population Census 2001-11-01 | Population Census 2011-11-01 | Population Census 2021-01-01 | Population Register 2025-01-01 | |
|---|---|---|---|---|---|---|---|---|
| Lagunilla | Salamanca | 892 | 772 | 609 | 547 | 450 | 417 | → |
Source: Instituto Nacional de Estadística, Madrid.
Explanation: The latest population figures are based on an evaluation of registers.
Further information about the population structure:
| Gender (R 2025) | |
|---|---|
| Males | 226 |
| Females | 191 |
| Age Groups (R 2025) | |
|---|---|
| 0-17 years | 30 |
| 18-64 years | 210 |
| 65+ years | 177 |
| Age Distribution (R 2025) | |
|---|---|
| 90+ years | 14 |
| 80-89 years | 45 |
| 70-79 years | 74 |
| 60-69 years | 88 |
| 50-59 years | 58 |
| 40-49 years | 34 |
| 30-39 years | 38 |
| 20-29 years | 30 |
| 10-19 years | 18 |
| 0-9 years | 18 |
| Citizenship (R 2025) | |
|---|---|
| Spain | 380 |
| EU | 30 |
| Africa | 1 |
| America | 6 |
| Country of Birth (R 2025) | |
|---|---|
| Spain | 370 |
| EU | 37 |
| Africa | 1 |
| America | 9 |