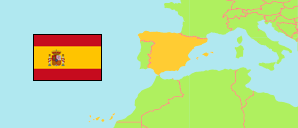
Cataluña
Autonomous Community in Spain
Contents: Subdivision
The population development in Cataluña as well as related information and services (Wikipedia, Google, images).
| Name | Status | Population Census 1981-03-01 | Population Census 1991-03-01 | Population Census 2001-11-01 | Population Census 2011-11-01 | Population Census 2021-01-01 | Population Evaluation 2024-01-01 | |
|---|---|---|---|---|---|---|---|---|
| Cataluña [Catalonia] | Autonomous Community | 5,956,414 | 6,059,494 | 6,343,110 | 7,519,838 | 7,749,896 | 8,012,231 | |
| Barcelona | Province | 4,623,204 | 4,654,407 | 4,805,927 | 5,522,566 | 5,702,262 | 5,877,672 | → |
| Girona (Gerona) | Province | 467,000 | 509,628 | 565,304 | 751,804 | 784,941 | 821,108 | → |
| Lleida (Lérida) | Province | 353,160 | 353,455 | 362,206 | 438,427 | 439,258 | 451,707 | → |
| Tarragona | Province | 513,050 | 542,004 | 609,673 | 807,041 | 823,435 | 861,744 | → |
| España [Spain] | Kingdom | 37,682,355 | 38,872,268 | 40,847,371 | 46,815,916 | 47,400,798 | 48,619,695 |
Source: Instituto Nacional de Estadística, Madrid.
Explanation: The latest population figures are based on an evaluation of registers.
Further information about the population structure:
| Gender (R 2024) | |
|---|---|
| Males | 3,943,698 |
| Females | 4,068,533 |
| Age Groups (R 2024) | |
|---|---|
| 0-17 years | 1,368,621 |
| 18-64 years | 5,078,112 |
| 65+ years | 1,565,498 |
| Age Distribution (R 2024) | |
|---|---|
| 90+ years | 103,589 |
| 80-89 years | 361,814 |
| 70-79 years | 677,590 |
| 60-69 years | 912,009 |
| 50-59 years | 1,191,517 |
| 40-49 years | 1,287,659 |
| 30-39 years | 1,016,100 |
| 20-29 years | 912,324 |
| 10-19 years | 877,425 |
| 0-9 years | 672,204 |
| Citizenship (R 2024) | |
|---|---|
| Spain | 6,568,039 |
| EU | 311,429 |
| Europe (Rest) | 135,314 |
| Africa | 334,386 |
| America | 466,188 |
| Asia and Oceania | 196,636 |
| Country of Birth (R 2024) | |
|---|---|
| Spain | 6,105,549 |
| EU | 253,621 |
| Europe (Rest) | 155,906 |
| Africa | 392,361 |
| America | 892,606 |
| Asia and Oceania | 212,188 |
