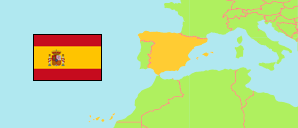
Andalucía
Autonomous Community in Spain
Contents: Subdivision
The population development in Andalucía as well as related information and services (Wikipedia, Google, images).
| Name | Status | Population Census 1981-03-01 | Population Census 1991-03-01 | Population Census 2001-11-01 | Population Census 2011-11-01 | Population Census 2021-01-01 | Population Register 2024-01-01 | |
|---|---|---|---|---|---|---|---|---|
| Andalucía [Andalusia] | Autonomous Community | 6,440,985 | 6,940,522 | 7,357,558 | 8,371,268 | 8,484,804 | 8,631,862 | |
| Almería | Province | 410,831 | 455,496 | 536,731 | 688,736 | 730,430 | 760,964 | → |
| Cádiz | Province | 988,388 | 1,078,404 | 1,116,491 | 1,244,730 | 1,249,873 | 1,258,730 | → |
| Córdoba | Province | 720,823 | 754,452 | 761,657 | 802,577 | 777,622 | 774,313 | → |
| Granada | Province | 758,618 | 790,515 | 821,660 | 922,097 | 925,046 | 939,741 | → |
| Huelva | Province | 418,584 | 443,476 | 462,579 | 519,894 | 527,254 | 535,734 | → |
| Jaén | Province | 639,821 | 637,633 | 643,820 | 667,482 | 627,568 | 619,055 | → |
| Málaga | Province | 1,025,609 | 1,160,843 | 1,287,017 | 1,594,813 | 1,696,955 | 1,774,701 | → |
| Sevilla [Seville] | Province | 1,478,311 | 1,619,703 | 1,727,603 | 1,930,939 | 1,950,056 | 1,968,624 | → |
| España [Spain] | Kingdom | 37,682,355 | 38,872,268 | 40,847,371 | 46,815,916 | 47,400,798 | 48,619,695 |
Source: Instituto Nacional de Estadística, Madrid.
Explanation: The latest population figures are based on an evaluation of registers.
Further information about the population structure:
| Gender (R 2024) | |
|---|---|
| Males | 4,249,355 |
| Females | 4,382,507 |
| Age Groups (R 2024) | |
|---|---|
| 0-17 years | 1,521,745 |
| 18-64 years | 5,496,904 |
| 65+ years | 1,613,213 |
| Age Distribution (R 2024) | |
|---|---|
| 90+ years | 80,980 |
| 80-89 years | 355,846 |
| 70-79 years | 700,595 |
| 60-69 years | 1,051,354 |
| 50-59 years | 1,340,985 |
| 40-49 years | 1,373,381 |
| 30-39 years | 1,072,686 |
| 20-29 years | 936,201 |
| 10-19 years | 973,363 |
| 0-9 years | 746,471 |
| Citizenship (R 2024) | |
|---|---|
| Spain | 7,779,071 |
| EU | 226,109 |
| Europe (Rest) | 144,381 |
| Africa | 223,183 |
| America | 213,865 |
| Asia and Oceania | 44,695 |
| Country of Birth (R 2024) | |
|---|---|
| Spain | 7,557,744 |
| EU | 228,826 |
| Europe (Rest) | 156,986 |
| Africa | 264,196 |
| America | 373,422 |
| Asia and Oceania | 50,688 |
