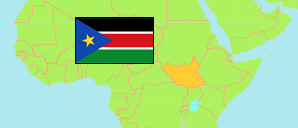
Eastern Equatoria
State in South Sudan
Contents: Subdivision
The population development in Eastern Equatoria as well as related information and services (Wikipedia, Google, images).
| Name | Status | Population Census 2008-04-22 | Population Projection 2017-07-01 | |
|---|---|---|---|---|
| Eastern Equatoria | State | 906,161 | 1,393,765 | |
| Budi | County | 99,234 | 153,314 | → |
| Ikotos | County | 84,649 | 129,620 | → |
| Kapoeta East | County | 163,997 | 252,271 | → |
| Kapoeta North | County | 103,084 | 158,889 | → |
| Kapoeta South | County | 79,470 | 122,651 | → |
| Lafon | County | 106,161 | 163,071 | → |
| Magwi | County | 169,826 | 260,634 | → |
| Torit | County | 99,740 | 153,314 | → |
Source: South Sudan National Bureau of Statistics (web).
Explanation: The population projection does not consider migration and displacement since 2008.
Further information about the population structure:
| Gender (C 2008) | |
|---|---|
| Males | 465,187 |
| Females | 440,974 |
| Age Groups (C 2008) | |
|---|---|
| 0-14 years | 400,689 |
| 15-64 years | 484,307 |
| 65+ years | 21,165 |
| Age Distribution (C 2008) | |
|---|---|
| 0-9 years | 266,996 |
| 10-19 years | 251,050 |
| 20-29 years | 153,754 |
| 30-39 years | 106,359 |
| 40-49 years | 63,087 |
| 50-59 years | 32,077 |
| 60-69 years | 32,838 |