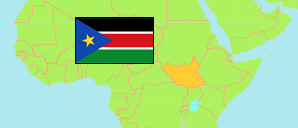
Jonglei
State in South Sudan
Contents: Subdivision
The population development in Jonglei as well as related information and services (Wikipedia, Google, images).
| Name | Status | Population Census 2008-04-22 | Population Projection 2017-07-01 | |
|---|---|---|---|---|
| Jonglei | State | 1,358,602 | 1,873,176 | |
| Akobo | County | 136,210 | 192,937 | → |
| Ayod | County | 139,282 | 192,937 | → |
| Bor South | County | 221,106 | 305,328 | → |
| Canal/Pigi | County | 99,068 | 136,742 | → |
| Duk | County | 65,588 | 89,912 | → |
| Fangak | County | 110,130 | 151,727 | → |
| Nyirol | County | 108,674 | 149,854 | → |
| Pibor | County | 148,475 | 204,176 | → |
| Pochalla | County | 66,201 | 91,786 | → |
| Twic East | County | 85,349 | 118,010 | → |
| Uror | County | 178,519 | 245,386 | → |
Source: South Sudan National Bureau of Statistics (web).
Explanation: The population projection does not consider migration and displacement since 2008.
Further information about the population structure:
| Gender (C 2008) | |
|---|---|
| Males | 734,327 |
| Females | 624,275 |
| Age Groups (C 2008) | |
|---|---|
| 0-14 years | 602,089 |
| 15-64 years | 721,471 |
| 65+ years | 35,042 |
| Age Distribution (C 2008) | |
|---|---|
| 0-9 years | 422,545 |
| 10-19 years | 325,685 |
| 20-29 years | 230,995 |
| 30-39 years | 165,375 |
| 40-49 years | 103,265 |
| 50-59 years | 55,034 |
| 60-69 years | 55,703 |