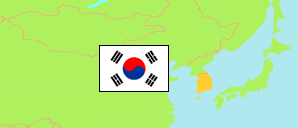
Ulju-gun
County in Ulsan Metropolitan City
Contents: Subdivision
The population development in Ulju-gun as well as related information and services (Wikipedia, Google, images).
| Name | Status | Native | Population Census 2005-11-01 | Population Census 2010-11-01 | Population Census 2015-11-01 | Population Census 2020-11-01 | |
|---|---|---|---|---|---|---|---|
| Ulju-gun | County | 울주군 | 165,365 | 189,038 | 222,739 | 225,050 | |
| Beomseo-eup | Town | 범서읍 | 38,181 | 60,453 | 70,852 | 68,848 | → |
| Cheongnyang-eup | Town | 청량읍 | 14,750 | 13,489 | 16,266 | 18,940 | → |
| Dudong-myeon | Rural Township | 두동면 | 3,126 | 3,259 | 3,620 | 4,173 | → |
| Duseo-myeon | Rural Township | 두서면 | 3,322 | 3,066 | 3,273 | 3,113 | → |
| Eonyang-eup | Town | 언양읍 | 22,787 | 23,798 | 29,712 | 28,895 | → |
| Onsan-eup | Town | 온산읍 | 22,009 | 23,812 | 28,809 | 24,235 | → |
| Onyang-eup | Town | 온양읍 | 21,211 | 21,713 | 24,874 | 28,272 | → |
| Samdong-myeon | Rural Township | 삼동면 | 1,592 | 1,822 | 1,902 | 1,781 | → |
| Samnam-eup | Town | 삼남읍 | 14,764 | 14,821 | 17,240 | 21,557 | → |
| Sangbuk-myeon | Rural Township | 상북면 | 8,683 | 8,486 | 8,689 | 8,305 | → |
| Seosaeng-myeon | Rural Township | 서생면 | 5,704 | 5,610 | 8,138 | 8,144 | → |
| Ungchon-myeon | Rural Township | 웅촌면 | 9,236 | 8,709 | 9,364 | 8,787 | → |
| Ulsan | Metropolitan City | 울산광역시 | 1,049,177 | 1,082,567 | 1,166,615 | 1,135,423 |
Source: National Statistical Office of the Republic of Korea (web).
Explanation: Since 2015, a register-based census is performed. Nevertheless, the results are not consistent with the population figures from the resident registration that are higher by about 3.5% on average. Area figures are derived from geospatial data.
Further information about the population structure:
| Gender (C 2020) | |
|---|---|
| Males | 117,739 |
| Females | 107,311 |
| Age Groups (C 2020) | |
|---|---|
| 0-14 years | 28,779 |
| 15-64 years | 164,024 |
| 65+ years | 32,247 |
| Age Distribution (C 2020) | |
|---|---|
| 90+ years | 939 |
| 80-89 years | 6,395 |
| 70-79 years | 13,428 |
| 60-69 years | 28,760 |
| 50-59 years | 42,090 |
| 40-49 years | 38,091 |
| 30-39 years | 28,086 |
| 20-29 years | 27,438 |
| 10-19 years | 21,811 |
| 0-9 years | 18,012 |
| Citizenship (C 2020) | |
|---|---|
| Korea | 215,454 |
| Foreign Citizenship | 9,596 |