
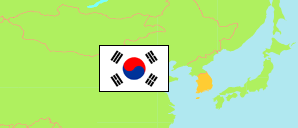
Yongsan-gu
City District in Seoul Metropolitan City
Contents: Subdivision
The population development in Yongsan-gu as well as related information and services (Wikipedia, Google, images).
 icon links to further information about a selected division including its population structure (gender, age groups, age distribution, citizenship).
| Name | Status | Native | Population Census 2005-11-01 | Population Census 2010-11-01 | Population Census 2015-11-01 | Population Census 2020-11-01 | Population Census 2025-11-01 | |
|---|---|---|---|---|---|---|---|---|
| Yongsan-gu | City District | 용산구 | 217,708 | 227,400 | 227,282 | 225,882 | 200,742 | |
| Bogwang-dong | Quarter | 보광동 | 17,905 | 17,280 | 16,404 | 14,966 | 7,448 | → |
| Cheongpa-dong | Quarter | 청파동 | 23,759 | 22,713 | 22,017 | 19,822 | 19,380 | → |
| Hangangno-dong | Quarter | 한강로동 | 11,278 | 14,718 | 14,626 | 19,821 | 20,805 | → |
| Hannam-dong | Quarter | 한남동 | 21,060 | 20,596 | 21,253 | 21,524 | 13,588 | → |
| Huam-dong | Quarter | 후암동 | 17,318 | 17,771 | 18,092 | 16,933 | 15,359 | → |
| Hyochang-dong | Quarter | 효창동 | 10,077 | 10,929 | 9,308 | 9,866 | 10,099 | → |
| Ichon 1-dong | Quarter | 이촌1동 | 25,996 | 26,853 | 25,412 | 26,195 | 23,182 | → |
| Ichon 2-dong | Quarter | 이촌2동 | 9,229 | 9,581 | 8,918 | 8,136 | 7,208 | → |
| Itaewon 1-dong | Quarter | 이태원1동 | 7,304 | 8,243 | 7,753 | 7,991 | 6,984 | → |
| Itaewon 2-dong | Quarter | 이태원2동 | 10,366 | 10,534 | 10,112 | 9,780 | 8,910 | → |
| Namyeong-dong | Quarter | 남영동 | 6,424 | 6,937 | 7,575 | 7,123 | 6,818 | → |
| Seobinggo-dong | Quarter | 서빙고동 | 9,966 | 10,448 | 13,068 | 12,672 | 11,428 | → |
| Wonhyoro 1-dong | Quarter | 원효로1동 | 5,933 | 10,197 | 13,472 | 15,443 | 16,768 | → |
| Wonhyoro 2-dong | Quarter | 원효로2동 | 15,080 | 15,138 | 14,738 | 13,436 | 12,822 | → |
| Yongmun-dong | Quarter | 용문동 | 12,728 | 12,536 | 12,267 | 11,669 | 10,691 | → |
| Yongsan 2 ga-dong | Quarter | 용산2가동 | 13,285 | 12,926 | 12,267 | 10,505 | 9,252 | → |
| Seoul | Metropolitan City | 서울특별시 | 9,820,171 | 9,794,304 | 9,904,312 | 9,586,195 | 9,315,066 |
Source: National Statistical Office of the Republic of Korea.
Explanation: Since 2015, a register-based census is performed. Nevertheless, the results are not consistent with the population figures from the resident registration that are higher by about 3.5% on average. Area figures are derived from geospatial data.
Further information about the population structure:
| Gender (C 2025) | |
|---|---|
| Males | 95,571 |
| Females | 105,171 |
| Age Groups (C 2025) | |
|---|---|
| 0-14 years | 15,575 |
| 15-64 years | 146,681 |
| 65+ years | 38,486 |
| Age Distribution (C 2025) | |
|---|---|
| 90+ years | 1,386 |
| 80-89 years | 8,105 |
| 70-79 years | 15,793 |
| 60-69 years | 27,955 |
| 50-59 years | 31,514 |
| 40-49 years | 29,271 |
| 30-39 years | 37,994 |
| 20-29 years | 26,809 |
| 10-19 years | 11,928 |
| 0-9 years | 9,987 |
| Citizenship (C 2025) | |
|---|---|
| Korea | 188,562 |
| Foreign Citizenship | 12,180 |