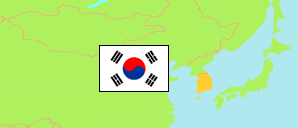
Wanju-gun
County in North Jeolla Province
Contents: Subdivision
The population development in Wanju-gun as well as related information and services (Wikipedia, Google, images).
| Name | Status | Native | Population Census 2005-11-01 | Population Census 2010-11-01 | Population Census 2015-11-01 | Population Census 2020-11-01 | |
|---|---|---|---|---|---|---|---|
| Wanju-gun | County | 완주군 | 79,541 | 83,408 | 95,357 | 95,834 | |
| Bibong-myeon | Rural Township | 비봉면 | 2,092 | 2,238 | 2,113 | 1,931 | → |
| Bongdong-eup | Town | 봉동읍 | 15,027 | 21,799 | 25,801 | 27,293 | → |
| Dongsang-myeon | Rural Township | 동상면 | 1,174 | 1,172 | 1,085 | 1,012 | → |
| Gosan-myeon | Rural Township | 고산면 | 4,535 | 4,738 | 4,580 | 4,585 | → |
| Gui-myeon | Rural Township | 구이면 | 5,315 | 4,825 | 5,591 | 5,601 | → |
| Gyeongcheon-myeon | Rural Township | 경천면 | 925 | 1,033 | 971 | 914 | → |
| Hwasan-myeon | Rural Township | 화산면 | 2,981 | 3,056 | 3,079 | 2,904 | → |
| Iseo-myeon | Rural Township | 이서면 | 6,348 | 6,189 | 13,755 | 14,201 | → |
| Samnye-eup | Town | 삼례읍 | 18,368 | 17,362 | 16,875 | 16,815 | → |
| Sanggwan-myeon | Rural Township | 상관면 | 5,322 | 5,130 | 5,092 | 5,022 | → |
| Soyang-myeon | Rural Township | 소양면 | 7,084 | 6,260 | 6,644 | 6,640 | → |
| Unju-myeon | Rural Township | 운주면 | 2,054 | 2,048 | 2,180 | 1,974 | → |
| Yongjin-eup | Town | 용진읍 | 8,316 | 7,558 | 7,591 | 6,942 | → |
| Jeollabuk-do [North Jeolla] | Province | 전라북도 | 1,784,013 | 1,777,220 | 1,834,114 | 1,802,766 |
Source: National Statistical Office of the Republic of Korea (web).
Explanation: Since 2015, a register-based census is performed. Nevertheless, the results are not consistent with the population figures from the resident registration that are higher by about 3.5% on average. Area figures are derived from geospatial data.
Further information about the population structure:
| Gender (C 2020) | |
|---|---|
| Males | 49,451 |
| Females | 46,383 |
| Age Groups (C 2020) | |
|---|---|
| 0-14 years | 11,153 |
| 15-64 years | 64,038 |
| 65+ years | 20,643 |
| Age Distribution (C 2020) | |
|---|---|
| 90+ years | 825 |
| 80-89 years | 5,142 |
| 70-79 years | 8,899 |
| 60-69 years | 13,221 |
| 50-59 years | 14,964 |
| 40-49 years | 13,553 |
| 30-39 years | 10,303 |
| 20-29 years | 12,641 |
| 10-19 years | 9,388 |
| 0-9 years | 6,898 |
| Citizenship (C 2020) | |
|---|---|
| Korea | 91,548 |
| Foreign Citizenship | 4,286 |