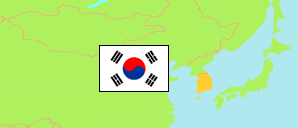
Yangju-si
City in Gyeonggi Province
Contents: Subdivision
The population development in Yangju-si as well as related information and services (Wikipedia, Google, images).
| Name | Status | Native | Population Census 2005-11-01 | Population Census 2010-11-01 | Population Census 2015-11-01 | Population Census 2020-11-01 | |
|---|---|---|---|---|---|---|---|
| Yangju-si | City | 양주시 | 152,007 | 187,911 | 205,988 | 233,286 | |
| Baekseok-eup | Town | 백석읍 | 24,781 | 27,798 | 28,302 | 26,392 | → |
| Eunhyeon-myeon | Rural Township | 은현면 | 7,348 | 7,045 | 8,458 | 7,697 | → |
| Gwangjeok-myeon | Rural Township | 광적면 | 9,972 | 10,998 | 12,931 | 13,363 | → |
| Hoecheon 1-dong | Quarter | 회천1동 | 7,379 | 6,697 | 10,666 | 10,060 | → |
| Hoecheon 2-dong | Quarter | 회천2동 | 24,051 | 27,664 | 28,230 | 26,994 | → |
| Hoecheon 3-dong | Quarter | 회천3동 | 23,656 | 29,011 | 28,978 | 27,230 | → |
| Hoecheon 4-dong | Quarter | 회천4동 | 7,666 | 4,290 | 10,188 | 47,352 | → |
| Jangheung-myeon | Rural Township | 장흥면 | 10,509 | 10,708 | 9,835 | 11,457 | → |
| Nam-myeon | Rural Township | 남면 | 7,628 | 7,269 | 9,247 | 8,425 | → |
| Yangju 1-dong | Quarter | 양주1동 | 7,431 | 6,008 | 5,967 | 5,082 | → |
| Yangju 2-dong | Quarter | 양주2동 | 21,586 | 50,423 | 53,186 | 49,234 | → |
| Gyeonggi-do | Province | 경기도 | 10,415,399 | 11,379,459 | 12,479,061 | 13,511,676 |
Source: National Statistical Office of the Republic of Korea (web).
Explanation: Since 2015, a register-based census is performed. Nevertheless, the results are not consistent with the population figures from the resident registration that are higher by about 3.5% on average. Area figures are derived from geospatial data.
Further information about the population structure:
| Gender (C 2020) | |
|---|---|
| Males | 119,562 |
| Females | 113,724 |
| Age Groups (C 2020) | |
|---|---|
| 0-14 years | 31,559 |
| 15-64 years | 164,688 |
| 65+ years | 37,039 |
| Age Distribution (C 2020) | |
|---|---|
| 90+ years | 1,345 |
| 80-89 years | 7,790 |
| 70-79 years | 16,400 |
| 60-69 years | 28,255 |
| 50-59 years | 37,694 |
| 40-49 years | 39,634 |
| 30-39 years | 30,415 |
| 20-29 years | 28,619 |
| 10-19 years | 23,290 |
| 0-9 years | 19,844 |
| Citizenship (C 2020) | |
|---|---|
| Korea | 223,364 |
| Foreign Citizenship | 9,922 |