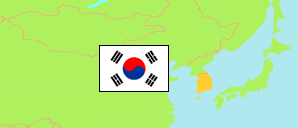
Yangyang-gun
County in Gangwon Province
Contents: Subdivision
The population development in Yangyang-gun as well as related information and services (Wikipedia, Google, images).
| Name | Status | Native | Population Census 2005-11-01 | Population Census 2010-11-01 | Population Census 2015-11-01 | Population Census 2020-11-01 | |
|---|---|---|---|---|---|---|---|
| Yangyang-gun | County | 양양군 | 29,617 | 25,475 | 25,861 | 26,748 | |
| Ganghyeon-myeon | Rural Township | 강현면 | 4,689 | 3,862 | 3,882 | 4,412 | → |
| Hyeonbuk-myeon | Rural Township | 현북면 | 2,826 | 2,523 | 2,602 | 2,480 | → |
| Hyeonnam-myeon | Rural Township | 현남면 | 3,741 | 2,896 | 2,952 | 2,954 | → |
| Seo-myeon | Rural Township | 서면 | 3,518 | 2,816 | 2,932 | 2,629 | → |
| Sonyang-myeon | Rural Township | 손양면 | 2,465 | 2,181 | 2,285 | 2,307 | → |
| Yangyang-eup | Town | 양양읍 | 12,378 | 11,197 | 11,208 | 11,966 | → |
| Gangwon-do | Province | 강원도 | 1,464,559 | 1,471,513 | 1,518,040 | 1,521,763 |
Source: National Statistical Office of the Republic of Korea (web).
Explanation: Since 2015, a register-based census is performed. Nevertheless, the results are not consistent with the population figures from the resident registration that are higher by about 3.5% on average. Area figures are derived from geospatial data.
Further information about the population structure:
| Gender (C 2020) | |
|---|---|
| Males | 13,568 |
| Females | 13,180 |
| Age Groups (C 2020) | |
|---|---|
| 0-14 years | 2,135 |
| 15-64 years | 16,573 |
| 65+ years | 8,040 |
| Age Distribution (C 2020) | |
|---|---|
| 90+ years | 298 |
| 80-89 years | 1,777 |
| 70-79 years | 3,563 |
| 60-69 years | 5,319 |
| 50-59 years | 4,880 |
| 40-49 years | 3,387 |
| 30-39 years | 2,371 |
| 20-29 years | 2,147 |
| 10-19 years | 1,677 |
| 0-9 years | 1,329 |
| Citizenship (C 2020) | |
|---|---|
| Korea | 26,328 |
| Foreign Citizenship | 420 |