
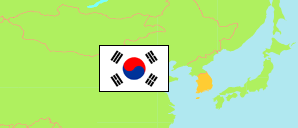
Gangneung-si
City in Gangwon Province
Contents: Subdivision
The population development in Gangneung-si as well as related information and services (Wikipedia, Google, images).
 icon links to further information about a selected division including its population structure (gender, age groups, age distribution, citizenship).
| Name | Status | Native | Population Census 2005-11-01 | Population Census 2010-11-01 | Population Census 2015-11-01 | Population Census 2020-11-01 | Population Census 2025-11-01 | |
|---|---|---|---|---|---|---|---|---|
| Gangneung-si | City | 강릉시 | 221,329 | 218,471 | 215,677 | 216,542 | 211,628 | |
| Chodang-dong | Quarter | 초당동 | 6,014 | 5,945 | 5,450 | 4,815 | 4,102 | → |
| Gangdong-myeon | Rural Township | 강동면 | 5,336 | 4,570 | 4,648 | 4,419 | 3,763 | → |
| Gangnam-dong | Quarter | 강남동 | 21,530 | 20,992 | 19,906 | 17,688 | 15,556 | → |
| Gujeong-myeon | Rural Township | 구정면 | 3,834 | 4,043 | 4,022 | 4,411 | 4,250 | → |
| Gyeongpo-dong | Quarter | 경포동 | 7,426 | 7,361 | 8,486 | 10,744 | 14,029 | → |
| Gyo 1-dong | Quarter | 교1동 | 30,755 | 30,297 | 28,729 | 27,322 | 27,087 | → |
| Gyo 2-dong | Quarter | 교2동 | 9,086 | 9,309 | 8,613 | 7,527 | 9,529 | → |
| Hongje-dong | Quarter | 홍제동 | 7,835 | 9,348 | 9,702 | 15,668 | 14,466 | → |
| Jumunjin-eup | Town | 주문진읍 | 20,913 | 17,698 | 17,041 | 15,771 | 15,414 | → |
| Jungang-dong | Quarter | 중앙동 | 6,679 | 6,013 | 5,550 | 5,175 | 4,242 | → |
| Naegok-dong | Quarter | 내곡동 | 14,862 | 16,444 | 16,853 | 19,005 | 21,630 | → |
| Okcheon-dong | Quarter | 옥천동 | 4,756 | 4,210 | 3,791 | 3,466 | 3,185 | → |
| Okgye-myeon | Rural Township | 옥계면 | 4,550 | 3,892 | 3,777 | 3,439 | 3,127 | → |
| Ponam 1-dong | Quarter | 포남1동 | 13,128 | 11,585 | 11,529 | 10,416 | 10,192 | → |
| Ponam 2-dong | Quarter | 포남2동 | 18,615 | 16,293 | 14,875 | 12,774 | 11,009 | → |
| Sacheon-myeon | Rural Township | 사천면 | 4,431 | 3,962 | 4,407 | 4,770 | 5,238 | → |
| Seongdeok-dong | Quarter | 성덕동 | 24,866 | 28,681 | 29,852 | 27,752 | 24,937 | → |
| Seongsan-myeon | Rural Township | 성산면 | 3,505 | 2,967 | 3,242 | 3,418 | 3,346 | → |
| Songjeong-dong | Quarter | 송정동 | 6,750 | 7,404 | 7,207 | 9,849 | 9,042 | → |
| Wangsan-myeon | Rural Township | 왕산면 | 1,328 | 1,209 | 1,419 | 1,445 | 1,355 | → |
| Yeongok-myeon | Rural Township | 연곡면 | 5,130 | 6,248 | 6,578 | 6,668 | 6,129 | → |
| Gangwon-do [Gangwon] | Province | 강원도 | 1,464,559 | 1,471,513 | 1,518,040 | 1,521,763 | 1,518,938 |
Source: National Statistical Office of the Republic of Korea.
Explanation: Since 2015, a register-based census is performed. Nevertheless, the results are not consistent with the population figures from the resident registration that are higher by about 3.5% on average. Area figures are derived from geospatial data.
Further information about the population structure:
| Gender (C 2025) | |
|---|---|
| Males | 105,589 |
| Females | 106,039 |
| Age Groups (C 2025) | |
|---|---|
| 0-14 years | 17,987 |
| 15-64 years | 137,617 |
| 65+ years | 56,024 |
| Age Distribution (C 2025) | |
|---|---|
| 90+ years | 2,190 |
| 80-89 years | 12,431 |
| 70-79 years | 22,678 |
| 60-69 years | 36,895 |
| 50-59 years | 36,167 |
| 40-49 years | 27,322 |
| 30-39 years | 21,239 |
| 20-29 years | 24,802 |
| 10-19 years | 17,748 |
| 0-9 years | 10,156 |
| Citizenship (C 2025) | |
|---|---|
| Korea | 206,639 |
| Foreign Citizenship | 4,989 |