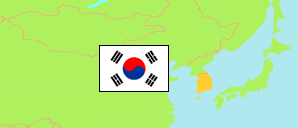
Chungju-si
City in North Chungcheong Province
Contents: Subdivision
The population development in Chungju-si as well as related information and services (Wikipedia, Google, images).
| Name | Status | Native | Population Census 2005-11-01 | Population Census 2010-11-01 | Population Census 2015-11-01 | Population Census 2020-11-01 | |
|---|---|---|---|---|---|---|---|
| Chungju-si | City | 충주시 | 204,800 | 203,212 | 211,005 | 218,412 | |
| Angseong-myeon | Rural Township | 앙성면 | 4,407 | 3,800 | 3,997 | 3,903 | → |
| Bongbang-dong | Quarter | 봉방동 | 9,102 | 8,241 | 10,439 | 9,526 | → |
| Chilgeumgeumneung-dong | Quarter | 칠금·금릉동 | 19,542 | 18,091 | 16,614 | 14,324 | → |
| Daesowon-myeon [Iryu-myeon] | Rural Township | 대소원면 | 6,613 | 6,410 | 8,681 | 11,523 | → |
| Dalcheon-dong | Quarter | 달천동 | 8,731 | 8,855 | 10,205 | 7,531 | → |
| Dongnyang-myeon | Rural Township | 동량면 | 3,988 | 3,518 | 3,801 | 3,781 | → |
| Eomjeong-myeon | Rural Township | 엄정면 | 3,812 | 3,126 | 3,358 | 3,168 | → |
| Geumga-myeon | Rural Township | 금가면 | 4,378 | 4,360 | 4,226 | 3,625 | → |
| Gyohyeon 2-dong | Quarter | 교현2동 | 11,015 | 9,338 | 8,890 | 7,360 | → |
| Gyohyeonalim-dong | Quarter | 교현·안림동 | 21,719 | 22,136 | 22,249 | 23,086 | → |
| Hoamjik-dong | Quarter | 호암·직동 | 9,883 | 10,956 | 11,067 | 17,931 | → |
| Jihyeon-dong | Quarter | 지현동 | 6,048 | 5,354 | 5,910 | 5,113 | → |
| Judeok-eup | Town | 주덕읍 | 6,046 | 5,534 | 5,576 | 5,212 | → |
| Jungangtap-myeon [Gageum-myeon] | Rural Township | 중앙탑면 | 2,749 | 2,300 | 2,563 | 13,203 | → |
| Mokhaengyongtan-dong | Quarter | 목행·용탄동 | 6,751 | 7,446 | 7,584 | 7,214 | → |
| Munhwa-dong | Quarter | 문화동 | 12,615 | 11,035 | 10,858 | 9,825 | → |
| Noeun-myeon | Rural Township | 노은면 | 2,604 | 2,201 | 2,334 | 2,259 | → |
| Salmi-myeon | Rural Township | 살미면 | 2,164 | 1,815 | 1,989 | 1,943 | → |
| Sancheok-myeon | Rural Township | 산척면 | 2,809 | 2,492 | 2,489 | 2,216 | → |
| Seongnaechungin-dong | Quarter | 성내·충인동 | 3,113 | 2,392 | 2,890 | 2,676 | → |
| Sinni-myeon | Rural Township | 신니면 | 3,660 | 3,668 | 3,534 | 3,240 | → |
| Sotae-myeon | Rural Township | 소태면 | 1,865 | 1,810 | 1,872 | 1,894 | → |
| Suanbo-myeon | Rural Township | 수안보면 | 3,352 | 3,118 | 3,120 | 5,315 | → |
| Yeonsu-dong | Quarter | 연수동 | 32,212 | 38,649 | 40,057 | 37,331 | → |
| Yongsan-dong | Quarter | 용산동 | 15,622 | 16,567 | 16,702 | 15,213 | → |
| Chungcheongbuk-do [North Chungcheong] | Province | 충청북도 | 1,460,453 | 1,512,157 | 1,589,347 | 1,632,088 |
Source: National Statistical Office of the Republic of Korea (web).
Explanation: Since 2015, a register-based census is performed. Nevertheless, the results are not consistent with the population figures from the resident registration that are higher by about 3.5% on average. Area figures are derived from geospatial data.
Further information about the population structure:
| Gender (C 2020) | |
|---|---|
| Males | 112,015 |
| Females | 106,397 |
| Age Groups (C 2020) | |
|---|---|
| 0-14 years | 23,528 |
| 15-64 years | 153,813 |
| 65+ years | 41,071 |
| Age Distribution (C 2020) | |
|---|---|
| 90+ years | 1,327 |
| 80-89 years | 9,774 |
| 70-79 years | 17,220 |
| 60-69 years | 30,894 |
| 50-59 years | 37,299 |
| 40-49 years | 30,874 |
| 30-39 years | 25,179 |
| 20-29 years | 31,635 |
| 10-19 years | 19,572 |
| 0-9 years | 14,638 |
| Citizenship (C 2020) | |
|---|---|
| Korea | 211,091 |
| Foreign Citizenship | 7,321 |