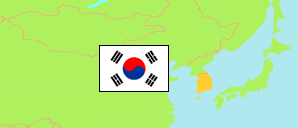
Gijang-gun
County in Busan Metropolitan City
Contents: Subdivision
The population development in Gijang-gun as well as related information and services (Wikipedia, Google, images).
| Name | Status | Native | Population Census 2005-11-01 | Population Census 2010-11-01 | Population Census 2015-11-01 | Population Census 2020-11-01 | |
|---|---|---|---|---|---|---|---|
| Gijang-gun | County | 기장군 | 73,031 | 93,783 | 148,073 | 169,465 | |
| Cheolma-myeon | Rural Township | 철마면 | 4,541 | 6,048 | 7,575 | 7,663 | → |
| Gijang-eup | Town | 기장읍 | 47,624 | 49,530 | 52,769 | 52,098 | → |
| Ilgwang-myeon | Rural Township | 일광면 | 7,667 | 7,064 | 8,410 | 20,366 | → |
| Jangan-eup | Town | 장안읍 | 8,263 | 8,419 | 9,091 | 8,668 | → |
| Jeonggwan-eup | Town | 정관읍 | 4,936 | 22,722 | 70,228 | 80,670 | → |
| Busan | Metropolitan City | 부산광역시 | 3,523,582 | 3,414,950 | 3,448,737 | 3,349,016 |
Source: National Statistical Office of the Republic of Korea (web).
Explanation: Since 2015, a register-based census is performed. Nevertheless, the results are not consistent with the population figures from the resident registration that are higher by about 3.5% on average. Area figures are derived from geospatial data.
Further information about the population structure:
| Gender (C 2020) | |
|---|---|
| Males | 83,788 |
| Females | 85,677 |
| Age Groups (C 2020) | |
|---|---|
| 0-14 years | 27,972 |
| 15-64 years | 114,916 |
| 65+ years | 26,577 |
| Age Distribution (C 2020) | |
|---|---|
| 90+ years | 756 |
| 80-89 years | 5,077 |
| 70-79 years | 11,797 |
| 60-69 years | 20,358 |
| 50-59 years | 23,102 |
| 40-49 years | 31,209 |
| 30-39 years | 25,134 |
| 20-29 years | 16,326 |
| 10-19 years | 16,740 |
| 0-9 years | 18,966 |
| Citizenship (C 2020) | |
|---|---|
| Korea | 166,947 |
| Foreign Citizenship | 2,518 |