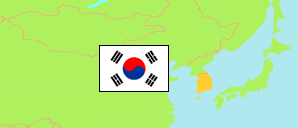
Jung-gu
City District in Busan Metropolitan City
Contents: Subdivision
The population development in Jung-gu as well as related information and services (Wikipedia, Google, images).
| Name | Status | Native | Population Census 2005-11-01 | Population Census 2010-11-01 | Population Census 2015-11-01 | Population Census 2020-11-01 | |
|---|---|---|---|---|---|---|---|
| Jung-gu [Central District] | City District | 중구 | 52,446 | 48,197 | 45,377 | 41,439 | |
| Bosu-dong | Quarter | 보수동 | 13,463 | 11,511 | 11,076 | 10,212 | → |
| Bupyeong-dong | Quarter | 부평동 | 5,635 | 4,940 | 5,229 | 4,502 | → |
| Daecheong-dong | Quarter | 대청동 | 8,205 | 7,562 | 7,379 | 6,305 | → |
| Donggwang-dong | Quarter | 동광동 | 4,298 | 3,896 | 3,430 | 2,865 | → |
| Gwangbok-dong | Quarter | 광복동 | 1,684 | 1,495 | 1,315 | 962 | → |
| Jungang-dong | Quarter | 중앙동 | 2,144 | 2,168 | 2,033 | 3,256 | → |
| Nampo-dong | Quarter | 남포동 | 1,546 | 1,430 | 1,433 | 1,208 | → |
| Yeongju 1-dong | Quarter | 영주1동 | 5,209 | 5,404 | 5,177 | 4,974 | → |
| Yeongju 2-dong | Quarter | 영주2동 | 10,262 | 9,791 | 8,305 | 7,155 | → |
| Busan | Metropolitan City | 부산광역시 | 3,523,582 | 3,414,950 | 3,448,737 | 3,349,016 |
Source: National Statistical Office of the Republic of Korea (web).
Explanation: Since 2015, a register-based census is performed. Nevertheless, the results are not consistent with the population figures from the resident registration that are higher by about 3.5% on average. Area figures are derived from geospatial data.
Further information about the population structure:
| Gender (C 2020) | |
|---|---|
| Males | 20,420 |
| Females | 21,019 |
| Age Groups (C 2020) | |
|---|---|
| 0-14 years | 2,125 |
| 15-64 years | 28,592 |
| 65+ years | 10,722 |
| Age Distribution (C 2020) | |
|---|---|
| 90+ years | 360 |
| 80-89 years | 2,020 |
| 70-79 years | 4,923 |
| 60-69 years | 7,539 |
| 50-59 years | 6,843 |
| 40-49 years | 5,473 |
| 30-39 years | 4,864 |
| 20-29 years | 6,097 |
| 10-19 years | 2,017 |
| 0-9 years | 1,303 |
| Citizenship (C 2020) | |
|---|---|
| Korea | 39,225 |
| Foreign Citizenship | 2,214 |