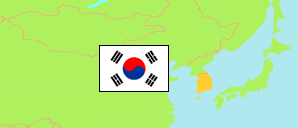
Gimje-si
City in Jeollabuk-do (South Korea)
Contents: Population
The population development of Gimje-si as well as related information and services (Wikipedia, Google, images).
| Name | Status | Native | Population Census 1980-11-01 | Population Census 1990-11-01 | Population Census 2000-11-01 | Population Census 2010-11-01 | Population Census 2015-11-01 | Population Census 2020-11-01 | |
|---|---|---|---|---|---|---|---|---|---|
| Gimje-si | City | 김제시 | 193,188 | 149,791 | 102,589 | 83,302 | 84,269 | 79,733 | |
| Daehan Minguk [South Korea] | Republic | 대한민국 | 37,436,315 | 43,410,899 | 46,136,101 | 48,580,293 | 51,069,375 | 51,829,136 |
Source: National Statistical Office of the Republic of Korea (web).
Explanation: Since 2015, a register-based census is performed. Nevertheless, the results are not consistent with the population figures from the resident registration that are higher by about 3.5% on average.
Further information about the population structure:
| Gender (C 2020) | |
|---|---|
| Males | 39,603 |
| Females | 40,130 |
| Age Groups (C 2020) | |
|---|---|
| 0-14 years | 7,067 |
| 15-64 years | 47,622 |
| 65+ years | 25,044 |
| Age Distribution (C 2020) | |
|---|---|
| 90+ years | 1,057 |
| 80-89 years | 6,842 |
| 70-79 years | 10,941 |
| 60-69 years | 13,795 |
| 50-59 years | 12,987 |
| 40-49 years | 9,636 |
| 30-39 years | 7,152 |
| 20-29 years | 7,239 |
| 10-19 years | 5,829 |
| 0-9 years | 4,255 |
| Citizenship (C 2020) | |
|---|---|
| Korea | 77,160 |
| Foreign Citizenship | 2,573 |