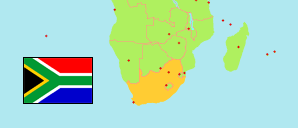
Mamusa
Local Municipality in South Africa
Contents: Population
The population development of Mamusa as well as related information and services (Wikipedia, Google, images).
| Name | Status | Population Census 1996-10-09 | Population Census 2001-10-09 | Population Census 2011-10-09 | Population Census 2022-02-02 | |
|---|---|---|---|---|---|---|
| Mamusa | Local Municipality | 42,736 | 48,366 | 60,355 | 70,483 | |
| South Africa | Republic | 40,583,573 | 44,819,778 | 51,770,560 | 62,027,503 |
Source: Statistics South Africa.
Explanation: Area figures for municipalities are calculated from geospatial data.
Further information about the population structure:
| Gender (C 2022) | |
|---|---|
| Males | 33,923 |
| Females | 36,560 |
| Age Groups (C 2022) | |
|---|---|
| 0-14 years | 23,138 |
| 15-64 years | 43,849 |
| 65+ years | 3,495 |
| Age Distribution (C 2022) | |
|---|---|
| 80+ years | 544 |
| 70-79 years | 1,457 |
| 60-69 years | 3,690 |
| 50-59 years | 5,063 |
| 40-49 years | 7,236 |
| 30-39 years | 10,657 |
| 20-29 years | 11,643 |
| 10-19 years | 14,618 |
| 0-9 years | 15,574 |
| Population Group (C 2022) | |
|---|---|
| Black African | 67,220 |
| White | 2,124 |
| Asian | 20 |
| Coloured | 1,020 |
| Other group | 99 |