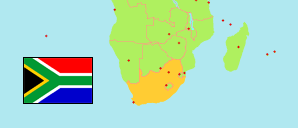
Limpopo
Province in South Africa
Contents: Subdivision
The population development in Limpopo as well as related information and services (Wikipedia, Google, images).
| Name | Status | Population Census 1996-10-09 | Population Census 2001-10-09 | Population Census 2011-10-09 | Population Census 2022-02-02 | |
|---|---|---|---|---|---|---|
| Limpopo (Northern Transvaal) | Province | 4,576,133 | 4,995,462 | 5,404,868 | 6,572,721 | |
| Ba-Phalaborwa | Local Municipality | 109,765 | 131,536 | 150,637 | 188,603 | → |
| Bela-Bela | Local Municipality | 47,592 | 52,124 | 66,500 | 64,306 | → |
| Blouberg (incl. Aganang (parts)) | Local Municipality | 174,154 | 186,202 | 175,085 | 192,109 | → |
| Collins Chabane (incl. Thulamela (parts)) | Local Municipality | 284,897 | 317,380 | 328,529 | 443,798 | → |
| Elias Motsoaledi (Greater Groblersdal) | Local Municipality | 218,740 | 221,647 | 249,363 | 288,049 | → |
| Ephraim Mogale (Greater Marble Hall) | Local Municipality | 97,988 | 121,327 | 123,648 | 132,468 | → |
| Fetakgomo Tubatse | Local Municipality | 326,796 | 361,965 | 428,948 | 575,960 | → |
| Greater Giyani | Local Municipality | 217,936 | 239,079 | 242,986 | 316,841 | → |
| Greater Letaba | Local Municipality | 203,536 | 221,191 | 213,932 | 261,038 | → |
| Greater Tzaneen | Local Municipality | 342,303 | 374,284 | 389,623 | 478,254 | → |
| Lepelle-Nkumpi | Local Municipality | 235,560 | 228,636 | 231,239 | 284,404 | → |
| Lephalale | Local Municipality | 78,715 | 86,933 | 118,864 | 125,198 | → |
| Makhado | Local Municipality | 352,627 | 387,265 | 411,353 | 502,452 | → |
| Makhuduthamaga | Local Municipality | 270,533 | 262,246 | 274,880 | 340,328 | → |
| Maruleng | Local Municipality | 88,096 | 95,685 | 95,328 | 128,137 | → |
| Modimolle-Mookgophong | Local Municipality | 63,217 | 103,568 | 104,153 | 130,113 | → |
| Mogalakwena | Local Municipality | 281,284 | 298,439 | 304,585 | 378,198 | → |
| Molemole (incl. Aganang (parts)) | Local Municipality | 130,246 | 129,344 | 126,506 | 127,130 | → |
| Musina (incl. Mutale (parts)) | Local Municipality | 59,291 | 70,636 | 104,709 | 130,899 | → |
| Polokwane (incl. Aganang (parts)) | Local Municipality | 532,670 | 618,735 | 728,633 | 843,459 | → |
| Thabazimbi | Local Municipality | 60,175 | 65,236 | 85,234 | 65,047 | → |
| Thulamela (incl. Mutale (parts), Thulamela (parts)) | Local Municipality | 400,011 | 422,003 | 450,131 | 575,929 | → |
| South Africa | Republic | 40,583,573 | 44,819,778 | 51,770,560 | 62,027,503 |
Source: Statistics South Africa.
Explanation: Area figures for municipalities are calculated from geospatial data.
Further information about the population structure:
| Gender (C 2022) | |
|---|---|
| Males | 3,099,416 |
| Females | 3,473,304 |
| Age Groups (C 2022) | |
|---|---|
| 0-14 years | 2,079,268 |
| 15-64 years | 4,038,543 |
| 65+ years | 454,635 |
| Age Distribution (C 2022) | |
|---|---|
| 80+ years | 105,233 |
| 70-79 years | 183,257 |
| 60-69 years | 383,181 |
| 50-59 years | 537,888 |
| 40-49 years | 691,326 |
| 30-39 years | 945,576 |
| 20-29 years | 1,083,666 |
| 10-19 years | 1,227,047 |
| 0-9 years | 1,415,272 |
| Population Group (C 2022) | |
|---|---|
| Black African | 6,341,597 |
| White | 167,524 |
| Asian | 35,958 |
| Coloured | 18,409 |
| Other group | 7,172 |