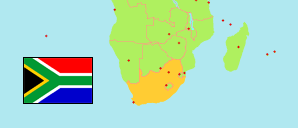
Mpumalanga
Province in South Africa
Contents: Subdivision
The population development in Mpumalanga as well as related information and services (Wikipedia, Google, images).
| Name | Status | Population Census 1996-10-09 | Population Census 2001-10-09 | Population Census 2011-10-09 | Population Census 2022-02-02 | |
|---|---|---|---|---|---|---|
| Mpumalanga (Eastern Transvaal) | Province | 3,124,203 | 3,365,957 | 4,039,939 | 5,143,324 | |
| Albert Luthuli | Local Municipality | 182,899 | 187,936 | 186,010 | 247,664 | → |
| Bushbuckridge | Local Municipality | 545,263 | 498,022 | 538,593 | 750,821 | → |
| City of Mbombela (incl. Umjindi) | Local Municipality | 475,459 | 532,878 | 658,604 | 818,925 | → |
| Dipaleseng | Local Municipality | 39,042 | 38,618 | 42,390 | 35,980 | → |
| Dr JS Moroka | Local Municipality | 259,766 | 243,313 | 249,705 | 324,855 | → |
| Emakhazeni (Highlands) | Local Municipality | 37,004 | 43,007 | 47,216 | 50,165 | → |
| Emalahleni | Local Municipality | 236,040 | 276,413 | 395,466 | 434,522 | → |
| Govan Mbeki (Highveld East) | Local Municipality | 209,626 | 221,747 | 294,538 | 310,117 | → |
| Lekwa | Local Municipality | 90,080 | 103,265 | 115,662 | 119,669 | → |
| Mkhondo | Local Municipality | 100,208 | 142,892 | 171,982 | 255,411 | → |
| Msukaligwa | Local Municipality | 105,368 | 124,812 | 149,377 | 199,314 | → |
| Nkomazi | Local Municipality | 277,864 | 334,544 | 393,030 | 591,928 | → |
| Pixley ka Seme | Local Municipality | 70,178 | 80,737 | 83,235 | 115,304 | → |
| Steve Tshwete (Middelburg) | Local Municipality | 135,335 | 142,772 | 229,831 | 242,031 | → |
| Thaba Chweu | Local Municipality | 65,635 | 81,681 | 98,387 | 109,223 | → |
| Thembisile | Local Municipality | 241,231 | 257,113 | 310,458 | 431,248 | → |
| Victor Khanye (Delmas) | Local Municipality | 53,208 | 56,208 | 75,452 | 106,149 | → |
| South Africa | Republic | 40,583,573 | 44,819,778 | 51,770,560 | 62,027,503 |
Source: Statistics South Africa.
Explanation: Area figures for municipalities are calculated from geospatial data.
Further information about the population structure:
| Gender (C 2022) | |
|---|---|
| Males | 2,469,794 |
| Females | 2,673,530 |
| Age Groups (C 2022) | |
|---|---|
| 0-14 years | 1,460,201 |
| 15-64 years | 3,414,686 |
| 65+ years | 268,117 |
| Age Distribution (C 2022) | |
|---|---|
| 80+ years | 47,095 |
| 70-79 years | 106,928 |
| 60-69 years | 264,835 |
| 50-59 years | 406,077 |
| 40-49 years | 584,920 |
| 30-39 years | 898,952 |
| 20-29 years | 950,005 |
| 10-19 years | 890,110 |
| 0-9 years | 994,082 |
| Population Group (C 2022) | |
|---|---|
| Black African | 4,898,021 |
| White | 185,730 |
| Asian | 25,882 |
| Coloured | 32,088 |
| Other group | 440 |