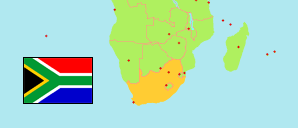
Free State
Province in South Africa
Contents: Subdivision
The population development in Free State as well as related information and services (Wikipedia, Google, images).
| Name | Status | Population Census 1996-10-09 | Population Census 2001-10-09 | Population Census 2011-10-09 | Population Census 2022-02-02 | |
|---|---|---|---|---|---|---|
| Free State (Oranje Free State) | Province | 2,633,504 | 2,706,775 | 2,745,590 | 2,964,412 | |
| Dihlabeng | Local Municipality | 107,798 | 129,338 | 128,704 | 130,434 | → |
| Kopanong | Local Municipality | 50,017 | 56,079 | 49,171 | 51,832 | → |
| Letsemeng | Local Municipality | 35,449 | 42,847 | 38,628 | 43,101 | → |
| Mafube | Local Municipality | 52,005 | 56,637 | 57,876 | 61,150 | → |
| Maluti a Phofung | Local Municipality | 353,238 | 360,549 | 335,784 | 398,459 | → |
| Mangaung (Bloemfontein; incl. Naledi) | Metropolitan Municipality | 630,784 | 675,281 | 775,184 | 811,431 | → |
| Mantsopa | Local Municipality | 50,081 | 55,342 | 51,056 | 55,897 | → |
| Masilonyana | Local Municipality | 63,507 | 62,048 | 59,895 | 63,800 | → |
| Matjhabeng | Local Municipality | 478,496 | 409,703 | 407,020 | 439,034 | → |
| Metsimaholo | Local Municipality | 106,912 | 115,955 | 149,108 | 158,391 | → |
| Mohokare | Local Municipality | 36,238 | 36,321 | 34,146 | 36,968 | → |
| Moqhaka | Local Municipality | 169,440 | 167,892 | 160,532 | 155,410 | → |
| Nala | Local Municipality | 82,141 | 98,264 | 81,220 | 90,561 | → |
| Ngwathe | Local Municipality | 120,007 | 118,810 | 120,520 | 134,962 | → |
| Nketoana | Local Municipality | 64,284 | 61,951 | 60,324 | 66,488 | → |
| Phumelela | Local Municipality | 46,657 | 51,928 | 47,772 | 52,224 | → |
| Setsoto | Local Municipality | 108,035 | 121,661 | 112,038 | 127,918 | → |
| Tokologo | Local Municipality | 26,767 | 32,455 | 28,986 | 29,455 | → |
| Tswelopele | Local Municipality | 51,648 | 53,714 | 47,625 | 56,896 | → |
| South Africa | Republic | 40,583,573 | 44,819,778 | 51,770,560 | 62,027,503 |
Source: Statistics South Africa.
Explanation: Area figures for municipalities are calculated from geospatial data.
Further information about the population structure:
| Gender (C 2022) | |
|---|---|
| Males | 1,407,824 |
| Females | 1,556,588 |
| Age Groups (C 2022) | |
|---|---|
| 0-14 years | 789,980 |
| 15-64 years | 1,967,412 |
| 65+ years | 206,983 |
| Age Distribution (C 2022) | |
|---|---|
| 80+ years | 32,551 |
| 70-79 years | 88,722 |
| 60-69 years | 194,301 |
| 50-59 years | 269,542 |
| 40-49 years | 351,396 |
| 30-39 years | 485,319 |
| 20-29 years | 493,499 |
| 10-19 years | 535,247 |
| 0-9 years | 513,798 |
| Population Group (C 2022) | |
|---|---|
| Black African | 2,630,556 |
| White | 235,915 |
| Asian | 12,978 |
| Coloured | 78,141 |
| Other group | 4,274 |