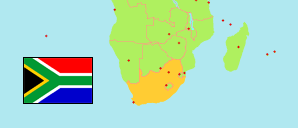
Western Cape
Province in South Africa
Contents: Subdivision
The population development in Western Cape as well as related information and services (Wikipedia, Google, images).
| Name | Status | Population Census 1996-10-09 | Population Census 2001-10-09 | Population Census 2011-10-09 | Population Census 2022-02-02 | |
|---|---|---|---|---|---|---|
| Western Cape | Province | 3,956,875 | 4,524,335 | 5,822,734 | 7,433,020 | |
| Beaufort West | Local Municipality | 40,693 | 43,290 | 49,586 | 72,972 | → |
| Bergrivier | Local Municipality | 37,030 | 46,538 | 61,897 | 70,276 | → |
| Bitou (Plettenberg Bay) | Local Municipality | 18,427 | 29,182 | 49,162 | 65,240 | → |
| Breede Valley | Local Municipality | 129,984 | 146,387 | 166,825 | 212,682 | → |
| Cape Agulhas | Local Municipality | 23,469 | 27,344 | 33,038 | 40,274 | → |
| Cederberg | Local Municipality | 31,704 | 39,559 | 49,768 | 55,108 | → |
| City of Cape Town | Metropolitan Municipality | 2,562,444 | 2,892,243 | 3,740,031 | 4,772,846 | → |
| Drakenstein | Local Municipality | 186,334 | 194,417 | 251,262 | 276,800 | → |
| George | Local Municipality | 120,148 | 149,436 | 193,672 | 294,929 | → |
| Hessequa (Langeberg) | Local Municipality | 38,553 | 44,114 | 52,642 | 71,918 | → |
| Kannaland | Local Municipality | 21,190 | 23,971 | 24,767 | 31,986 | → |
| Knysna | Local Municipality | 43,599 | 52,035 | 68,659 | 96,055 | → |
| Laingsburg | Local Municipality | 5,913 | 6,680 | 8,289 | 11,366 | → |
| Langeberg (Breede River/Winelands) | Local Municipality | 67,083 | 81,684 | 97,724 | 94,045 | → |
| Matzikama | Local Municipality | 43,906 | 54,199 | 67,147 | 69,043 | → |
| Mossel Bay | Local Municipality | 59,789 | 71,494 | 89,430 | 140,075 | → |
| Oudtshoorn | Local Municipality | 79,181 | 84,692 | 95,933 | 138,257 | → |
| Overstrand | Local Municipality | 36,231 | 54,206 | 80,358 | 132,495 | → |
| Prince Albert | Local Municipality | 9,508 | 10,512 | 13,136 | 17,836 | → |
| Saldanha Bay | Local Municipality | 57,012 | 70,261 | 99,193 | 154,635 | → |
| Stellenbosch | Local Municipality | 104,530 | 118,709 | 155,728 | 175,411 | → |
| Swartland | Local Municipality | 64,601 | 72,115 | 113,762 | 148,331 | → |
| Swellendam | Local Municipality | 24,579 | 28,285 | 35,916 | 47,114 | → |
| Theewaterskloof | Local Municipality | 74,582 | 93,894 | 108,864 | 139,563 | → |
| Witzenberg | Local Municipality | 76,386 | 89,087 | 115,946 | 103,765 | → |
| South Africa | Republic | 40,583,573 | 44,819,778 | 51,770,560 | 62,027,503 |
Source: Statistics South Africa.
Explanation: Area figures for municipalities are calculated from geospatial data.
Further information about the population structure:
| Gender (C 2022) | |
|---|---|
| Males | 3,602,159 |
| Females | 3,830,860 |
| Age Groups (C 2022) | |
|---|---|
| 0-14 years | 1,666,841 |
| 15-64 years | 5,225,826 |
| 65+ years | 539,673 |
| Age Distribution (C 2022) | |
|---|---|
| 80+ years | 90,215 |
| 70-79 years | 239,177 |
| 60-69 years | 489,007 |
| 50-59 years | 719,070 |
| 40-49 years | 990,685 |
| 30-39 years | 1,360,304 |
| 20-29 years | 1,344,059 |
| 10-19 years | 1,092,680 |
| 0-9 years | 1,107,143 |
| Population Group (C 2022) | |
|---|---|
| Black African | 2,882,777 |
| White | 1,217,337 |
| Asian | 84,327 |
| Coloured | 3,124,727 |
| Other group | 115,235 |