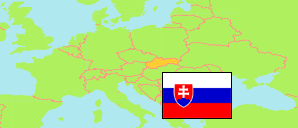
Trenčín
District in Slovakia
Contents: Population
The population development of Trenčín as well as related information and services (Wikipedia, Google, images).
| Name | Status | Population Census 1991-03-03 | Population Census 2001-05-26 | Population Census 2011-05-21 | Population Census 2021-01-01 | Population Estimate 2023-12-31 | |
|---|---|---|---|---|---|---|---|
| Trenčín | District | 111,366 | 112,767 | 113,115 | 113,777 | 113,225 | |
| Slovensko [Slovakia] | Republic | 5,274,335 | 5,379,455 | 5,397,036 | 5,449,270 | 5,424,687 |
Source: Statistical Office of the Slovak Republic.
Further information about the population structure:
| Gender (E 2023) | |
|---|---|
| Males | 55,210 |
| Females | 58,015 |
| Age Groups (E 2023) | |
|---|---|
| 0-17 years | 19,990 |
| 18-64 years | 69,748 |
| 65+ years | 23,487 |
| Age Distribution (E 2023) | |
|---|---|
| 90+ years | 680 |
| 80-89 years | 4,264 |
| 70-79 years | 10,993 |
| 60-69 years | 14,600 |
| 50-59 years | 14,890 |
| 40-49 years | 18,993 |
| 30-39 years | 16,168 |
| 20-29 years | 10,550 |
| 10-19 years | 10,935 |
| 0-9 years | 11,152 |
| Urbanization (C 2021) | |
|---|---|
| Rural | 48,722 |
| Urban | 65,055 |
| Citizenship (C 2021) | |
|---|---|
| Slovakia | 112,872 |
| Foreign Citizenship | 850 |
| Country of Birth (C 2021) | |
|---|---|
| Slovakia | 108,859 |
| Other country | 4,710 |
| Ethnic Group (C 2021) | |
|---|---|
| Slovak | 107,537 |
| Hungarian | 166 |
| Romani | 40 |
| Ruthenian | 34 |
| Czech | 1,094 |
| Other ethnic groups | 620 |
| Mother Tongue (C 2021) | |
|---|---|
| Slovak | 106,566 |
| Hungarian | 215 |
| Romani | 13 |
| Ruthenian | 66 |
| Czech | 1,290 |
| Other language | 736 |
| Religion (C 2021) | |
|---|---|
| Roman Catholics | 69,302 |
| Evangelical Church | 6,386 |
| Greek Catholics | 720 |
| Reformed (Calvinists) | 84 |
| Orthodox | 208 |
| Other christian church | 905 |
| Other religion | 1,232 |
| No religion | 29,368 |
