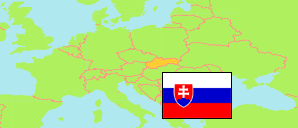
Prievidza
District in Slovakia
Contents: Population
The population development of Prievidza as well as related information and services (Wikipedia, Google, images).
| Name | Status | Population Census 1991-03-03 | Population Census 2001-05-26 | Population Census 2011-05-21 | Population Census 2021-01-01 | Population Estimate 2023-12-31 | |
|---|---|---|---|---|---|---|---|
| Prievidza | District | 138,537 | 140,444 | 137,894 | 131,693 | 128,613 | |
| Slovensko [Slovakia] | Republic | 5,274,335 | 5,379,455 | 5,397,036 | 5,449,270 | 5,424,687 |
Source: Statistical Office of the Slovak Republic.
Further information about the population structure:
| Gender (E 2023) | |
|---|---|
| Males | 63,039 |
| Females | 65,574 |
| Age Groups (E 2023) | |
|---|---|
| 0-17 years | 20,358 |
| 18-64 years | 81,170 |
| 65+ years | 27,085 |
| Age Distribution (E 2023) | |
|---|---|
| 90+ years | 637 |
| 80-89 years | 4,688 |
| 70-79 years | 12,515 |
| 60-69 years | 18,412 |
| 50-59 years | 18,877 |
| 40-49 years | 21,001 |
| 30-39 years | 17,721 |
| 20-29 years | 12,213 |
| 10-19 years | 11,596 |
| 0-9 years | 10,953 |
| Urbanization (C 2021) | |
|---|---|
| Rural | 61,302 |
| Urban | 70,391 |
| Citizenship (C 2021) | |
|---|---|
| Slovakia | 130,792 |
| Foreign Citizenship | 855 |
| Country of Birth (C 2021) | |
|---|---|
| Slovakia | 126,490 |
| Other country | 4,967 |
| Ethnic Group (C 2021) | |
|---|---|
| Slovak | 122,638 |
| Hungarian | 293 |
| Romani | 96 |
| Ruthenian | 20 |
| Czech | 573 |
| Other ethnic groups | 810 |
| Mother Tongue (C 2021) | |
|---|---|
| Slovak | 121,799 |
| Hungarian | 376 |
| Romani | 55 |
| Ruthenian | 30 |
| Czech | 732 |
| Other language | 796 |
| Religion (C 2021) | |
|---|---|
| Roman Catholics | 69,398 |
| Evangelical Church | 1,608 |
| Greek Catholics | 709 |
| Reformed (Calvinists) | 168 |
| Orthodox | 174 |
| Other christian church | 1,608 |
| Other religion | 1,356 |
| No religion | 47,594 |
