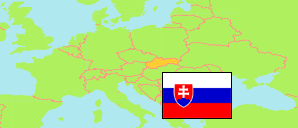
Humenné
District in Slovakia
Contents: Population
The population development of Humenné as well as related information and services (Wikipedia, Google, images).
| Name | Status | Population Census 1991-03-03 | Population Census 2001-05-26 | Population Census 2011-05-21 | Population Census 2021-01-01 | Population Estimate 2023-12-31 | |
|---|---|---|---|---|---|---|---|
| Humenné | District | 63,011 | 64,845 | 64,446 | 60,126 | 58,688 | |
| Slovensko [Slovakia] | Republic | 5,274,335 | 5,379,455 | 5,397,036 | 5,449,270 | 5,424,687 |
Source: Statistical Office of the Slovak Republic.
Further information about the population structure:
| Gender (E 2023) | |
|---|---|
| Males | 28,728 |
| Females | 29,960 |
| Age Groups (E 2023) | |
|---|---|
| 0-17 years | 9,639 |
| 18-64 years | 37,748 |
| 65+ years | 11,301 |
| Age Distribution (E 2023) | |
|---|---|
| 90+ years | 266 |
| 80-89 years | 1,826 |
| 70-79 years | 5,386 |
| 60-69 years | 7,898 |
| 50-59 years | 8,194 |
| 40-49 years | 9,202 |
| 30-39 years | 8,519 |
| 20-29 years | 6,606 |
| 10-19 years | 5,688 |
| 0-9 years | 5,103 |
| Urbanization (C 2021) | |
|---|---|
| Rural | 28,767 |
| Urban | 31,359 |
| Citizenship (C 2021) | |
|---|---|
| Slovakia | 59,800 |
| Foreign Citizenship | 271 |
| Country of Birth (C 2021) | |
|---|---|
| Slovakia | 57,973 |
| Other country | 2,064 |
| Ethnic Group (C 2021) | |
|---|---|
| Slovak | 53,391 |
| Hungarian | 66 |
| Romani | 786 |
| Ruthenian | 1,892 |
| Czech | 197 |
| Other ethnic groups | 525 |
| Mother Tongue (C 2021) | |
|---|---|
| Slovak | 52,291 |
| Hungarian | 93 |
| Romani | 800 |
| Ruthenian | 3,012 |
| Czech | 253 |
| Other language | 415 |
| Religion (C 2021) | |
|---|---|
| Roman Catholics | 38,148 |
| Evangelical Church | 314 |
| Greek Catholics | 9,774 |
| Reformed (Calvinists) | 109 |
| Orthodox | 1,919 |
| Other christian church | 515 |
| Other religion | 326 |
| No religion | 5,641 |
