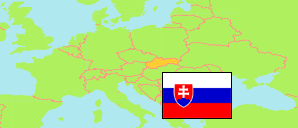
Lučenec
District in Slovakia
Contents: Population
The population development of Lučenec as well as related information and services (Wikipedia, Google, images).
| Name | Status | Population Census 1991-03-03 | Population Census 2001-05-26 | Population Census 2011-05-21 | Population Census 2021-01-01 | Population Estimate 2023-12-31 | |
|---|---|---|---|---|---|---|---|
| Lučenec | District | 73,419 | 73,301 | 74,861 | 70,422 | 69,018 | |
| Slovensko [Slovakia] | Republic | 5,274,335 | 5,379,455 | 5,397,036 | 5,449,270 | 5,424,687 |
Source: Statistical Office of the Slovak Republic.
Further information about the population structure:
| Gender (E 2023) | |
|---|---|
| Males | 33,515 |
| Females | 35,503 |
| Age Groups (E 2023) | |
|---|---|
| 0-17 years | 12,669 |
| 18-64 years | 43,673 |
| 65+ years | 12,676 |
| Age Distribution (E 2023) | |
|---|---|
| 90+ years | 282 |
| 80-89 years | 2,145 |
| 70-79 years | 5,843 |
| 60-69 years | 9,075 |
| 50-59 years | 9,422 |
| 40-49 years | 11,181 |
| 30-39 years | 9,396 |
| 20-29 years | 7,476 |
| 10-19 years | 7,469 |
| 0-9 years | 6,729 |
| Urbanization (C 2021) | |
|---|---|
| Rural | 34,571 |
| Urban | 35,851 |
| Citizenship (C 2021) | |
|---|---|
| Slovakia | 69,679 |
| Foreign Citizenship | 689 |
| Country of Birth (C 2021) | |
|---|---|
| Slovakia | 67,808 |
| Other country | 2,456 |
| Ethnic Group (C 2021) | |
|---|---|
| Slovak | 47,324 |
| Hungarian | 16,580 |
| Romani | 1,329 |
| Ruthenian | 11 |
| Czech | 236 |
| Other ethnic groups | 356 |
| Mother Tongue (C 2021) | |
|---|---|
| Slovak | 46,092 |
| Hungarian | 18,866 |
| Romani | 107 |
| Ruthenian | 19 |
| Czech | 269 |
| Other language | 397 |
| Religion (C 2021) | |
|---|---|
| Roman Catholics | 38,640 |
| Evangelical Church | 6,488 |
| Greek Catholics | 419 |
| Reformed (Calvinists) | 355 |
| Orthodox | 72 |
| Other christian church | 1,281 |
| Other religion | 529 |
| No religion | 17,111 |
