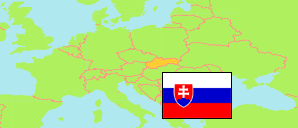
Prešovský kraj
Region in Slovakia
Contents: Subdivision
The population development in Prešovský kraj as well as related information and services (Wikipedia, Google, images).
| Name | Status | Population Census 1991-03-03 | Population Census 2001-05-26 | Population Census 2011-05-21 | Population Census 2021-01-01 | Population Estimate 2023-12-31 | |
|---|---|---|---|---|---|---|---|
| Prešovský kraj [Prešov] | Region | 739,264 | 789,968 | 814,527 | 808,931 | 808,810 | |
| Bardejov | District | 71,106 | 75,793 | 77,859 | 76,012 | 75,547 | → |
| Humenné | District | 63,011 | 64,845 | 64,446 | 60,126 | 58,688 | → |
| Kežmarok | District | 56,203 | 63,231 | 70,487 | 73,685 | 75,188 | → |
| Levoča | District | 29,298 | 31,880 | 33,262 | 33,107 | 33,192 | → |
| Medzilaborce | District | 13,122 | 12,668 | 12,450 | 11,056 | 10,665 | → |
| Poprad | District | 97,926 | 104,348 | 103,914 | 102,744 | 102,038 | → |
| Prešov | District | 151,045 | 161,782 | 169,423 | 172,804 | 174,741 | → |
| Sabinov | District | 49,200 | 54,067 | 57,820 | 60,389 | 61,542 | → |
| Snina | District | 38,593 | 39,633 | 38,129 | 35,125 | 34,071 | → |
| Stará Ľubovňa | District | 46,513 | 50,684 | 52,866 | 52,968 | 53,107 | → |
| Stropkov | District | 20,098 | 21,027 | 20,931 | 19,878 | 19,553 | → |
| Svidník | District | 32,127 | 33,506 | 33,238 | 31,611 | 31,183 | → |
| Vranov nad Topľou | District | 71,022 | 76,504 | 79,702 | 79,426 | 79,295 | → |
| Slovensko [Slovakia] | Republic | 5,274,335 | 5,379,455 | 5,397,036 | 5,449,270 | 5,424,687 |
Source: Statistical Office of the Slovak Republic.
Further information about the population structure:
| Gender (E 2023) | |
|---|---|
| Males | 400,104 |
| Females | 408,706 |
| Age Groups (E 2023) | |
|---|---|
| 0-17 years | 176,736 |
| 18-64 years | 502,149 |
| 65+ years | 129,925 |
| Age Distribution (E 2023) | |
|---|---|
| 90+ years | 3,569 |
| 80-89 years | 21,666 |
| 70-79 years | 59,198 |
| 60-69 years | 93,763 |
| 50-59 years | 100,668 |
| 40-49 years | 118,062 |
| 30-39 years | 117,593 |
| 20-29 years | 98,859 |
| 10-19 years | 96,255 |
| 0-9 years | 99,177 |
| Urbanization (C 2021) | |
|---|---|
| Rural | 439,678 |
| Urban | 369,253 |
| Citizenship (C 2021) | |
|---|---|
| Slovakia | 803,571 |
| Foreign Citizenship | 4,868 |
| Country of Birth (C 2021) | |
|---|---|
| Slovakia | 782,107 |
| Other country | 25,557 |
| Ethnic Group (C 2021) | |
|---|---|
| Slovak | 715,782 |
| Hungarian | 809 |
| Romani | 28,141 |
| Ruthenian | 19,601 |
| Czech | 2,576 |
| Other ethnic groups | 6,284 |
| Mother Tongue (C 2021) | |
|---|---|
| Slovak | 675,093 |
| Hungarian | 1,037 |
| Romani | 53,677 |
| Ruthenian | 32,365 |
| Czech | 3,117 |
| Other language | 5,957 |
| Religion (C 2021) | |
|---|---|
| Roman Catholic | 487,966 |
| Evangelical Church | 35,597 |
| Greek Catholic | 114,401 |
| Reformed (Calvinists) | 780 |
| Orthodox | 26,993 |
| Other christian church | 11,358 |
| Other religion | 4,181 |
| No religion | 85,927 |