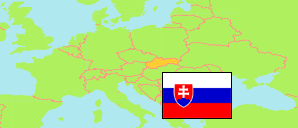
Trenčiansky kraj
Region in Slovakia
Contents: Subdivision
The population development in Trenčiansky kraj as well as related information and services (Wikipedia, Google, images).
| Name | Status | Population Census 1991-03-03 | Population Census 2001-05-26 | Population Census 2011-05-21 | Population Census 2021-01-01 | Population Estimate 2023-12-31 | |
|---|---|---|---|---|---|---|---|
| Trenčiansky kraj [Trenčín] | Region | 600,575 | 605,582 | 594,328 | 577,464 | 568,102 | |
| Bánovce nad Bebravou | District | 38,474 | 38,640 | 37,128 | 35,967 | 35,186 | → |
| Ilava | District | 61,047 | 62,042 | 60,578 | 58,058 | 56,920 | → |
| Myjava | District | 30,228 | 29,243 | 27,531 | 25,678 | 25,013 | → |
| Nové Mesto nad Váhom | District | 64,630 | 63,530 | 62,707 | 61,840 | 61,349 | → |
| Partizánske | District | 48,157 | 48,005 | 47,166 | 44,515 | 43,509 | → |
| Považská Bystrica | District | 63,033 | 65,150 | 63,550 | 61,617 | 60,577 | → |
| Prievidza | District | 138,537 | 140,444 | 137,894 | 131,693 | 128,613 | → |
| Púchov | District | 45,103 | 45,761 | 44,659 | 44,319 | 43,710 | → |
| Trenčín | District | 111,366 | 112,767 | 113,115 | 113,777 | 113,225 | → |
| Slovensko [Slovakia] | Republic | 5,274,335 | 5,379,455 | 5,397,036 | 5,449,270 | 5,424,687 |
Source: Statistical Office of the Slovak Republic.
Further information about the population structure:
| Gender (E 2023) | |
|---|---|
| Males | 278,822 |
| Females | 289,280 |
| Age Groups (E 2023) | |
|---|---|
| 0-17 years | 96,240 |
| 18-64 years | 355,582 |
| 65+ years | 116,280 |
| Age Distribution (E 2023) | |
|---|---|
| 90+ years | 2,971 |
| 80-89 years | 20,181 |
| 70-79 years | 53,927 |
| 60-69 years | 77,911 |
| 50-59 years | 79,051 |
| 40-49 years | 93,126 |
| 30-39 years | 80,129 |
| 20-29 years | 54,551 |
| 10-19 years | 53,211 |
| 0-9 years | 53,044 |
| Urbanization (C 2021) | |
|---|---|
| Rural | 263,903 |
| Urban | 313,561 |
| Citizenship (C 2021) | |
|---|---|
| Slovakia | 573,171 |
| Foreign Citizenship | 4,021 |
| Country of Birth (C 2021) | |
|---|---|
| Slovakia | 554,029 |
| Other country | 22,429 |
| Ethnic Group (C 2021) | |
|---|---|
| Slovak | 543,403 |
| Hungarian | 841 |
| Romani | 426 |
| Ruthenian | 129 |
| Czech | 3,779 |
| Other ethnic groups | 2,995 |
| Mother Tongue (C 2021) | |
|---|---|
| Slovak | 540,262 |
| Hungarian | 1,044 |
| Romani | 163 |
| Ruthenian | 193 |
| Czech | 4,676 |
| Other language | 3,237 |
| Religion (C 2021) | |
|---|---|
| Roman Catholics | 335,222 |
| Evangelical Church | 41,278 |
| Greek Catholics | 2,979 |
| Reformed (Calvinists) | 539 |
| Orthodox | 817 |
| Other christian church | 5,521 |
| Other religion | 5,747 |
| No religion | 152,586 |
