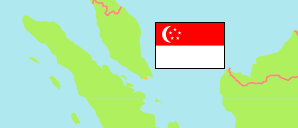
Sengkang
Planning Area in Singapore
Contents: Subdivision
The population development in Sengkang as well as related information and services (Wikipedia, Google, images).
| Name | Status | Population Census 2000-06-30 | Population Census 2010-06-30 | Population Estimate 2015-06-30 | Population Census 2020-06-30 | Population Estimate 2025-06-30 | |
|---|---|---|---|---|---|---|---|
| Sengkang | Planning Area | 60,870 | 167,054 | 206,680 | 249,370 | 267,600 | |
| Anchorvale (Buangkok) | Subzone | ... | 30,751 | 38,040 | 48,120 | 52,390 | → |
| Compassvale (Trafalgar) | Subzone | ... | 13,624 | 18,510 | 20,960 | 21,760 | → |
| Fernvale (Jalan Kayu East) | Subzone | ... | 12,786 | 35,590 | 58,800 | 71,200 | → |
| Lorong Halus North (Sungei Serangoon East) | Subzone | ... | ... | ... | ... | ... | → |
| Rivervale (Sungei Serangoon West) | Subzone | ... | ... | 59,860 | 59,700 | 62,470 | → |
| Sengkang Town Centre | Subzone | ... | 52,148 | 54,680 | 61,790 | 59,770 | → |
| Sengkang West (Jalan Kayu West) | Subzone | ... | ... | 10 | 10 | ... | → |
| Singapore | Republic | 3,273,360 | 3,771,720 | 3,902,690 | 4,044,210 | 4,204,520 |
Source: Singapore Department of Statistics.
Explanation: Non-resident population (1,641,597 and 1,906,660 in Singapore in 2020 and 2025, respectively) is not included in the tabulated figures. All censuses are register-based, i.e., basic population count and characteristics such as age, gender, ethnic group and place of residence were obtained from administrative records and do not differ from estimates. Area figures are calculated by using geospatial data.
Further information about the population structure:
| Gender (E 2025) | |
|---|---|
| Males | 131,030 |
| Females | 136,580 |
| Age Groups (E 2025) | |
|---|---|
| 0-14 years | 45,340 |
| 15-64 years | 186,940 |
| 65+ years | 35,330 |
| Age Distribution (E 2025) | |
|---|---|
| 90+ years | 830 |
| 80-89 years | 4,430 |
| 70-79 years | 16,310 |
| 60-69 years | 29,070 |
| 50-59 years | 36,600 |
| 40-49 years | 46,660 |
| 30-39 years | 43,360 |
| 20-29 years | 29,370 |
| 10-19 years | 32,450 |
| 0-9 years | 28,530 |
| Ethnic Group (C 2020) | |
|---|---|
| Chinese | 192,870 |
| Malay | 28,560 |
| Indian | 21,690 |
| Other group | 6,240 |