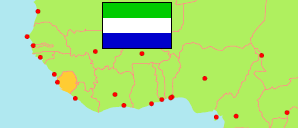
Port Loko
District in Sierra Leone
Contents: Subdivision
The population development in Port Loko as well as related information and services (Wikipedia, Google, images).
| Name | Status | Population Census 2004-12-04 | Population Census 2015-12-04 | Population Census 2021-12-09 | |
|---|---|---|---|---|---|
| Port Loko | District | 388,236 | 530,865 | 528,038 | |
| Bakeh Loko | Chiefdom | ... | 7,773 | 5,771 | → |
| Bureh | Chiefdom | ... | 15,666 | 17,554 | → |
| Kaffu Bullom | Chiefdom | 69,637 | 120,490 | 107,402 | → |
| Kamasondo | Chiefdom | ... | 29,983 | 35,035 | → |
| Kasseh | Chiefdom | ... | 14,511 | 11,443 | → |
| Koya | Chiefdom | 63,614 | 85,177 | 86,543 | → |
| Loko Masama | Chiefdom | ... | 48,293 | 60,268 | → |
| Maconteh | Chiefdom | ... | 10,002 | 11,336 | → |
| Maforki | Chiefdom | ... | 35,954 | 39,133 | → |
| Makama | Chiefdom | ... | 9,514 | 9,339 | → |
| Marampa | Chiefdom | 36,108 | 59,323 | 57,137 | → |
| Masimera | Chiefdom | 32,845 | 40,843 | 37,595 | → |
| Port Loko | City | ... | 43,037 | 40,804 | → |
| Thainkatopa | Chiefdom | ... | 10,299 | 8,678 | → |
| Sierra Leone | Republic | 4,976,871 | 7,092,113 | 7,548,702 |
Source: Statistics Sierra Leone (web).
Explanation: Boundaries of districts and chiefdoms according to the administrative reorganization of 2017. The 2021 census is a mid-term census. The reasons for the significant differences between the 2015 and 2021 figures are unclear. Area figures are derived from geospatial data.