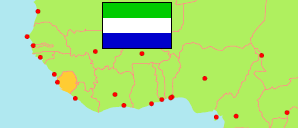
Bombali
District in Sierra Leone
Contents: Subdivision
The population development in Bombali as well as related information and services (Wikipedia, Google, images).
| Name | Status | Population Census 2004-12-04 | Population Census 2015-12-04 | Population Census 2021-12-09 | |
|---|---|---|---|---|---|
| Bombali | District | 270,923 | 422,960 | 387,236 | |
| Biriwa | Chiefdom | 28,175 | 47,305 | 40,787 | → |
| Bombali Shebora | Chiefdom | ... | 28,979 | 32,065 | → |
| Bombali Siari | Chiefdom | ... | 7,434 | 8,820 | → |
| Gbanti | Chiefdom | ... | 42,130 | 54,295 | → |
| Gbendembu | Chiefdom | ... | 18,452 | 17,424 | → |
| Kamaranka | Chiefdom | ... | 11,852 | 11,493 | → |
| Magbaimba Ndorwahun | Chiefdom | 8,655 | 12,688 | 9,692 | → |
| Makari | Chiefdom | ... | 39,215 | 42,803 | → |
| Makeni | City | 82,840 | 125,970 | 85,116 | → |
| Mara | Chiefdom | ... | 17,451 | 11,795 | → |
| N'gowahun | Chiefdom | ... | 20,348 | 21,139 | → |
| Paki Masabong | Chiefdom | 17,320 | 19,880 | 22,414 | → |
| Safroko Limba | Chiefdom | 21,199 | 31,256 | 29,393 | → |
| Sierra Leone | Republic | 4,976,871 | 7,092,113 | 7,548,702 |
Source: Statistics Sierra Leone (web).
Explanation: Boundaries of districts and chiefdoms according to the administrative reorganization of 2017. The 2021 census is a mid-term census. The reasons for the significant differences between the 2015 and 2021 figures are unclear. Area figures are derived from geospatial data.