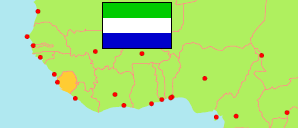
Kenema
District in Sierra Leone
Contents: Subdivision
The population development in Kenema as well as related information and services (Wikipedia, Google, images).
| Name | Status | Population Census 2004-12-04 | Population Census 2015-12-04 | Population Census 2021-12-09 | |
|---|---|---|---|---|---|
| Kenema | District | 497,948 | 609,891 | 772,472 | |
| Dama | Chiefdom | 26,157 | 30,751 | 37,994 | → |
| Dodo | Chiefdom | 14,194 | 22,858 | 21,143 | → |
| Gaura | Chiefdom | 17,361 | 18,217 | 34,704 | → |
| Gorama Mende | Chiefdom | 32,539 | 43,359 | 48,332 | → |
| Kandu Leppiama | Chiefdom | 21,743 | 18,229 | 22,722 | → |
| Kenema | City | 128,402 | 200,443 | 255,110 | → |
| Koya | Chiefdom | 10,184 | 13,482 | 19,338 | → |
| Langrama | Chiefdom | 4,356 | 3,584 | 4,474 | → |
| Lower Bambara | Chiefdom | 78,389 | 76,281 | 91,477 | → |
| Malegohun | Chiefdom | 12,224 | 20,544 | 19,519 | → |
| Niawa | Chiefdom | 8,496 | 7,815 | 12,827 | → |
| Nomo | Chiefdom | 4,105 | 5,491 | 9,351 | → |
| Nongowa | Chiefdom | 51,486 | 45,562 | 67,567 | → |
| Simbaru | Chiefdom | 18,375 | 17,397 | 22,868 | → |
| Small Bo | Chiefdom | 31,193 | 29,498 | 41,744 | → |
| Tunkia | Chiefdom | 21,330 | 36,054 | 41,320 | → |
| Wandor | Chiefdom | 17,414 | 20,326 | 21,982 | → |
| Sierra Leone | Republic | 4,976,871 | 7,092,113 | 7,548,702 |
Source: Statistics Sierra Leone (web).
Explanation: Boundaries of districts and chiefdoms according to the administrative reorganization of 2017. The 2021 census is a mid-term census. The reasons for the significant differences between the 2015 and 2021 figures are unclear. Area figures are derived from geospatial data.