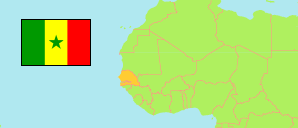
Kolda
Region in Senegal
Contents: Subdivision
The population development in Kolda as well as related information and services (Wikipedia, Google, images).
| Name | Status | Population Census 2013-11-19 | Population Census 2023-08-18 | |
|---|---|---|---|---|
| Kolda | Region | 662,455 | 914,798 | |
| Badion | Rural Community | 12,584 | 17,878 | → |
| Bagadadji | Rural Community | 15,366 | 20,086 | → |
| Bignarabé | Rural Community | 6,774 | 7,766 | → |
| Bonconto | Rural Community | 10,232 | 13,455 | → |
| Bourouco | Rural Community | 25,242 | 35,461 | → |
| Coumbacara | Rural Community | 10,131 | 15,025 | → |
| Dabo | Commune | 6,069 | 9,611 | → |
| Dialambéré | Rural Community | 13,302 | 16,959 | → |
| Diaobé - Kabendou | Commune | 26,165 | 41,411 | → |
| Dinguiraye | Rural Community | 14,666 | 18,514 | → |
| Dioulacolon | Rural Community | 20,751 | 32,090 | → |
| Fafacourou | Rural Community | 7,068 | 10,911 | → |
| Guiro Yéro Bocar | Rural Community | 15,556 | 18,900 | → |
| Kandia | Rural Community | 21,074 | 28,768 | → |
| Kandiaye | Rural Community | 12,693 | 15,351 | → |
| Kéréwane | Rural Community | 32,803 | 41,030 | → |
| Kolda | Commune | 81,098 | 103,574 | → |
| Koulinto | Rural Community | 6,858 | 8,675 | → |
| Kounkané | Commune | 10,798 | 16,216 | → |
| Linkéring | Rural Community | 17,059 | 22,486 | → |
| Mampatim | Rural Community | 15,400 | 21,955 | → |
| Médina Chérif | Rural Community | 12,924 | 15,918 | → |
| Médina El Hadj | Rural Community | 11,785 | 15,204 | → |
| Médina Gounass | Rural Community | 48,220 | 91,085 | → |
| Médina Yoro Foulah | Commune | 3,000 | 4,936 | → |
| Ndorna | Rural Community | 12,231 | 16,168 | → |
| Némataba | Rural Community | 10,554 | 11,883 | → |
| Niaming | Rural Community | 13,740 | 19,852 | → |
| Ouassadou | Rural Community | 16,529 | 20,849 | → |
| Pakour | Rural Community | 12,504 | 16,237 | → |
| Paroumba | Rural Community | 14,838 | 19,220 | → |
| Pata | Commune | 3,118 | 4,265 | → |
| Salikégné | Commune | 3,677 | 4,641 | → |
| Saré Bidji | Rural Community | 16,753 | 22,371 | → |
| Saré Coly Sallé | Rural Community | 19,000 | 24,469 | → |
| Saré Yoba Diéga | Commune | 3,551 | 4,199 | → |
| Sinthiang Koundara | Rural Community | 26,554 | 38,288 | → |
| Tankanto Escale | Rural Community | 15,256 | 18,348 | → |
| Thiétty | Rural Community | 4,372 | 5,311 | → |
| Vélingara | Commune | 32,161 | 45,431 | → |
| Sénégal | Republic | 13,508,715 | 18,126,390 |
Source: Agence Nationale de la Statistique et de la Démographie, Sénégal.
Explanation: Area figures of departments are computed by using geospatial data.