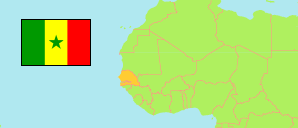
Diourbel
Region in Senegal
Contents: Subdivision
The population development in Diourbel as well as related information and services (Wikipedia, Google, images).
| Name | Status | Population Census 2013-11-19 | Population Census 2023-08-18 | |
|---|---|---|---|---|
| Diourbel | Region | 1,497,455 | 2,080,335 | |
| Baba Garage | Rural Community | 15,815 | 18,305 | → |
| Bambey | Commune | 28,908 | 37,374 | → |
| Dalla Ngabou | Rural Community | 8,600 | 12,609 | → |
| Darou Nahim | Rural Community | 2,358 | 2,942 | → |
| Darou Salam Typ | Rural Community | 5,522 | 7,245 | → |
| Dendeye Gouy Gui | Rural Community | 5,370 | 7,061 | → |
| Dinguiraye | Rural Community | 9,385 | 11,881 | → |
| Diourbel | Commune | 133,705 | 157,554 | → |
| Gade Escale | Rural Community | 3,241 | 4,521 | → |
| Gawane | Rural Community | 14,373 | 19,907 | → |
| Kael | Rural Community | 5,413 | 7,144 | → |
| Keur Ngalgou | Rural Community | 7,214 | 9,760 | → |
| Keur Samba Kane | Rural Community | 19,299 | 21,036 | → |
| Lambaye | Rural Community | 27,847 | 30,486 | → |
| Madina | Rural Community | 5,630 | 8,763 | → |
| Mbacké | Commune | 77,255 | 101,451 | → |
| Missirah | Rural Community | 6,968 | 8,416 | → |
| Ndangalma | Rural Community | 32,640 | 44,398 | → |
| Ndankh Sene | Rural Community | 9,631 | 12,410 | → |
| Ndindy | Rural Community | 14,197 | 17,326 | → |
| Ndioumane | Rural Community | 4,223 | 6,651 | → |
| Ndondol | Rural Community | 24,347 | 25,843 | → |
| Ndoulo | Rural Community | 12,150 | 14,820 | → |
| Nghaye | Rural Community | 4,746 | 6,777 | → |
| Ngogom | Rural Community | 25,464 | 40,948 | → |
| Ngohe | Rural Community | 30,190 | 40,758 | → |
| Ngoye | Rural Community | 46,176 | 54,238 | → |
| Patar | Rural Community | 17,072 | 26,656 | → |
| Réfane | Rural Community | 33,727 | 39,955 | → |
| Sadio | Rural Community | 17,569 | 24,444 | → |
| Taïba Moutoupha | Rural Community | 10,383 | 13,890 | → |
| Taïba Thiékène | Rural Community | 1,738 | 2,465 | → |
| Taïf | Rural Community | 14,788 | 18,233 | → |
| Thiakhar | Rural Community | 21,496 | 32,096 | → |
| Tocky Gare | Rural Community | 14,727 | 24,821 | → |
| Touba Fall | Rural Community | 6,114 | 11,500 | → |
| Touba Lappé | Rural Community | 3,317 | 5,127 | → |
| Touba Mboul | Rural Community | 10,156 | 13,231 | → |
| Touba Mosquée | Rural Community | 753,315 | 1,120,824 | → |
| Toure Mbonde | Rural Community | 12,391 | 16,466 | → |
| Sénégal | Republic | 13,508,715 | 18,126,390 |
Source: Agence Nationale de la Statistique et de la Démographie, Sénégal.
Explanation: Area figures of departments are computed by using geospatial data.