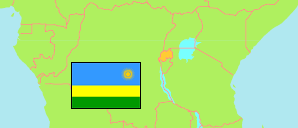
Nyabihu
District in Rwanda
Contents: Subdivision
The population development in Nyabihu as well as related information and services (Wikipedia, Google, images).
| Name | Status | Population Census 2012-08-15 | Population Census 2022-08-15 | |
|---|---|---|---|---|
| Nyabihu | District | 294,740 | 319,047 | |
| Bigogwe | Sector | 31,657 | 34,439 | → |
| Jenda | Sector | 34,648 | 43,168 | → |
| Jomba | Sector | 20,610 | 21,897 | → |
| Kabatwa | Sector | 18,971 | 20,841 | → |
| Karago | Sector | 25,681 | 25,832 | → |
| Kintobo | Sector | 15,379 | 15,315 | → |
| Mukamira | Sector | 28,675 | 33,013 | → |
| Muringa | Sector | 22,876 | 22,599 | → |
| Rambura | Sector | 28,484 | 28,820 | → |
| Rugera | Sector | 24,236 | 26,938 | → |
| Rurembo | Sector | 23,689 | 24,399 | → |
| Shyira | Sector | 19,834 | 21,786 | → |
| Rwanda | Republic | 10,515,973 | 13,246,394 |
Source: National Institute of Statistics Rwanda.
Further information about the population structure:
| Gender (C 2022) | |
|---|---|
| Males | 150,072 |
| Females | 168,975 |
| Age Groups (C 2022) | |
|---|---|
| 0-14 years | 122,639 |
| 15-64 years | 183,439 |
| 65+ years | 12,969 |
| Age Distribution (C 2022) | |
|---|---|
| 80+ years | 2,679 |
| 70-79 years | 5,210 |
| 60-69 years | 12,080 |
| 50-59 years | 14,724 |
| 40-49 years | 26,519 |
| 30-39 years | 42,131 |
| 20-29 years | 52,254 |
| 10-19 years | 80,957 |
| 0-9 years | 82,493 |
| Urbanization (C 2022) | |
|---|---|
| Rural | 241,020 |
| Urban | 78,027 |