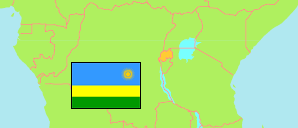
Nyarugenge
District in Rwanda
Contents: Population
The population development of Nyarugenge as well as related information and services (Wikipedia, Google, images).
| Name | Status | Population Census 2002-08-16 | Population Census 2012-08-15 | Population Census 2022-08-15 | |
|---|---|---|---|---|---|
| Nyarugenge | District | 236,990 | 284,561 | 374,319 | |
| Rwanda | Republic | 8,128,553 | 10,515,973 | 13,246,394 |
Source: National Institute of Statistics Rwanda.
Further information about the population structure:
| Gender (C 2022) | |
|---|---|
| Males | 195,780 |
| Females | 178,539 |
| Age Groups (C 2022) | |
|---|---|
| 0-14 years | 116,687 |
| 15-64 years | 250,012 |
| 65+ years | 7,620 |
| Age Distribution (C 2022) | |
|---|---|
| 80+ years | 1,434 |
| 70-79 years | 3,081 |
| 60-69 years | 7,998 |
| 50-59 years | 15,538 |
| 40-49 years | 37,107 |
| 30-39 years | 68,563 |
| 20-29 years | 86,325 |
| 10-19 years | 70,439 |
| 0-9 years | 83,834 |
| Urbanization (C 2022) | |
|---|---|
| Rural | 58,420 |
| Urban | 315,899 |
| Citizenship (C 2022) | |
|---|---|
| Rwanda | 371,043 |
| Foreign Citizenship | 3,276 |
| Literacy (A15+) (C 2022) | |
|---|---|
| yes | 239,300 |
| no | 18,300 |