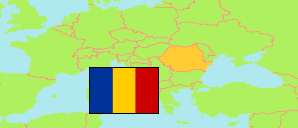
Dâmbovița
County in Romania
Contents: Population
The population development of Dâmbovița as well as related information and services (Wikipedia, Google, images).
| Name | Status | Population Census 1977-01-05 | Population Census 1992-01-07 | Population Census 2002-03-18 | Population Census 2011-10-20 | Population Census 2021-12-01 | |
|---|---|---|---|---|---|---|---|
| Dâmbovița | County | 527,620 | 562,041 | 541,763 | 518,745 | 479,404 | |
| România [Romania] | Sovereign State | 21,559,910 | 22,810,035 | 21,680,974 | 20,121,641 | 19,053,815 |
Source: Romania National Institute of Statistics (web).
Further information about the population structure:
| Gender (C 2021) | |
|---|---|
| Males | 234,743 |
| Females | 244,661 |
| Age Groups (C 2021) | |
|---|---|
| 0-14 years | 74,185 |
| 15-64 years | 312,952 |
| 65+ years | 92,267 |
| Age Distribution (C 2021) | |
|---|---|
| 80+ years | 21,290 |
| 70-79 years | 40,156 |
| 60-69 years | 60,978 |
| 50-59 years | 69,100 |
| 40-49 years | 74,892 |
| 30-39 years | 62,142 |
| 20-29 years | 49,847 |
| 10-19 years | 53,768 |
| 0-9 years | 47,231 |
| Urbanization (C 2021) | |
|---|---|
| Rural | 349,456 |
| Urban | 129,948 |
| Citizenship (C 2021) | |
|---|---|
| Romanian | 478,693 |
| Foreign Citizenship | 711 |
| Place of Birth (C 2021) | |
|---|---|
| Same place | 340,851 |
| Other place in same county | 68,123 |
| Other county in Romania | 62,979 |
| European Union | 4,619 |
| Other country | 2,832 |