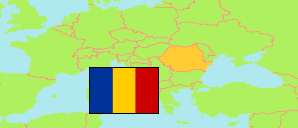
Cluj
County in Romania
Contents: Population
The population development of Cluj as well as related information and services (Wikipedia, Google, images).
| Name | Status | Population Census 1977-01-05 | Population Census 1992-01-07 | Population Census 2002-03-18 | Population Census 2011-10-20 | Population Census 2021-12-01 | Population Estimate 2024-01-01 | |
|---|---|---|---|---|---|---|---|---|
| Cluj | County | 715,507 | 736,301 | 702,755 | 691,106 | 679,141 | 694,149 | |
| România [Romania] | Sovereign State | 21,559,910 | 22,810,035 | 21,680,974 | 20,121,641 | 19,053,815 | 19,064,409 |
Source: Romania National Institute of Statistics.
Further information about the population structure:
| Gender (E 2024) | |
|---|---|
| Males | 335,028 |
| Females | 359,121 |
| Age Groups (E 2024) | |
|---|---|
| 0-17 years | 127,703 |
| 18-64 years | 430,783 |
| 65+ years | 135,663 |
| Age Distribution (E 2024) | |
|---|---|
| 80+ years | 31,368 |
| 70-79 years | 60,766 |
| 60-69 years | 80,680 |
| 50-59 years | 91,317 |
| 40-49 years | 103,775 |
| 30-39 years | 107,040 |
| 20-29 years | 78,488 |
| 10-19 years | 68,046 |
| 0-9 years | 72,669 |
| Urbanization (E 2024) | |
|---|---|
| Rural | 279,387 |
| Urban | 414,762 |
| Citizenship (C 2021) | |
|---|---|
| Romania | 676,111 |
| Foreign Citizenship | 3,030 |
| Place of Birth (C 2021) | |
|---|---|
| Same place | 363,340 |
| Other place in same county | 136,131 |
| Other county in Romania | 165,581 |
| European Union | 7,475 |
| Other country | 6,614 |
