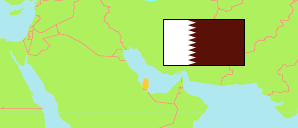
Ash-Shaḥāniyah
Municipality in Qatar
Contents: Subdivision
The population development in Ash-Shaḥāniyah as well as related information and services (Wikipedia, Google, images).
| Name | Status | Native | Population Census 1986-03-16 | Population Census 1997-03-01 | Population Census 2004-03-16 | Population Census 2010-04-20 | Population Census 2015-04-20 | Population Census 2020-12-31 | |
|---|---|---|---|---|---|---|---|---|---|
| Ash-Shaḥāniyah [Al Shahaniya] | Municipality | الشيحانية | 12,841 | 19,328 | 23,445 | 62,962 | 187,571 | 161,240 | |
| Al-Jumayliyah [Al Jemailiya] | Zone 73 | الجميلية | 1,636 | 1,303 | 1,367 | 1,706 | 1,685 | 2,573 | → |
| Al-'Uṭūriyah [Al Utouriya] | Zone 72 | العطورية | 761 | 915 | 939 | 1,060 | 1,232 | 1,608 | → |
| An-Naṣrāniyah [Al Nasraniya] | Zone 85 | النصرانية | 443 | 490 | 593 | 1,043 | 1,308 | 3,331 | → |
| Ash-Shaḥāniyah [Al Shahaniya] | Zone 80 | الشيحانية | 4,654 | 6,852 | 8,380 | 35,393 | 138,509 | 67,181 | → |
| Dukhān [Dukhan] | Zone 86 | دخان | 3,341 | 5,299 | 6,117 | 11,520 | 13,274 | 10,202 | → |
| Rawḍat Rāshid [Rawdat Rashed] | Zone 82 | روضة راشد | 970 | 2,640 | 4,762 | 6,046 | 26,258 | 74,576 | → |
| Umm Bāb [Umm Bab] | Zone 84 | ام باب | 1,036 | 1,829 | 1,287 | 6,194 | 5,305 | 1,769 | → |
| Qaṭar [Qatar] | State | قطر | 369,078 | 522,023 | 744,029 | 1,699,435 | 2,404,776 | 2,846,118 |
Source: Qatar Planning and Statistics Authority (web).
Explanation: Zones as defined for the 2020 census. Older population figures may not consider boundary changes of zones. Thus, slight discrepancies are possible.
Further information about the population structure:
| Gender (C 2020) | |
|---|---|
| Males | 148,384 |
| Females | 12,856 |
| Age Groups (C 2015) | |
|---|---|
| 0-14 years | 8,503 |
| 15-64 years | 178,098 |
| 65+ years | 970 |
| Age Distribution (C 2015) | |
|---|---|
| 0-9 years | 6,299 |
| 10-19 years | 6,839 |
| 20-29 years | 70,969 |
| 30-39 years | 60,283 |
| 40-49 years | 30,272 |
| 50-59 years | 10,316 |
| 60-69 years | 2,145 |
| 70-79 years | 316 |
| 80+ years | 132 |