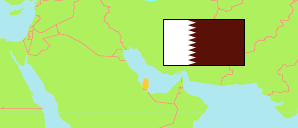
Al-Wakrah
Municipality in Qatar
Contents: Subdivision
The population development in Al-Wakrah as well as related information and services (Wikipedia, Google, images).
| Name | Status | Native | Population Census 1986-03-16 | Population Census 1997-03-01 | Population Census 2004-03-16 | Population Census 2010-04-20 | Population Census 2015-04-20 | Population Census 2020-12-31 | |
|---|---|---|---|---|---|---|---|---|---|
| Al-Wakrah | Municipality | الوكرة | 21,273 | 29,960 | 43,384 | 118,895 | 299,037 | 265,102 | |
| Al-Kharārah [Al Kharrara] | Zone 95 | الخرارة | 185 | 134 | 48 | 126 | 3,478 | 6,458 | → |
| Al-'Udaīd [Al Adaid] | Zone 98 | العديد | 55 | 91 | 0 | 42 | 7 | 4 | → |
| Al-Wakrah [Al Wakra] | Zone 90 | الوكرة | 12,092 | 19,009 | 26,579 | 58,965 | 87,970 | 94,272 | → |
| Ath-Thumāmah / Al-Wukaīr / Al-Mashāf [Al Thumama / Al Wukair / Al Mashaf] | Zone 91 | الثمامة / الوكير / المشاف | 2,570 | 3,177 | 4,083 | 20,615 | 165,214 | 134,481 | → |
| Minṭaqat Musaī'īd aṣ-Ṣinā'iyah [Mesaieed Industrial Area] | Zone 93 | منطقة مسيعيد الصناعية | 255 | 92 | 9 | 123 | 106 | 172 | → |
| Musaī'īd [Mesaieed] | Zone 92 | مسيعيد | 6,094 | 7,424 | 12,611 | 35,150 | 37,548 | 29,330 | → |
| Shaqrā [Shagra] | Zone 94 | شقرا | 22 | 33 | 54 | 3,874 | 4,714 | 385 | → |
| Qaṭar [Qatar] | State | قطر | 369,078 | 522,023 | 744,029 | 1,699,435 | 2,404,776 | 2,846,118 |
Source: Qatar Planning and Statistics Authority (web).
Explanation: Zones as defined for the 2020 census. Older population figures may not consider boundary changes of zones. Thus, slight discrepancies are possible.
Further information about the population structure:
| Gender (C 2020) | |
|---|---|
| Males | 184,827 |
| Females | 80,275 |
| Age Groups (C 2015) | |
|---|---|
| 0-14 years | 29,281 |
| 15-64 years | 267,412 |
| 65+ years | 2,344 |
| Age Distribution (C 2015) | |
|---|---|
| 0-9 years | 21,552 |
| 10-19 years | 15,244 |
| 20-29 years | 89,038 |
| 30-39 years | 96,678 |
| 40-49 years | 51,675 |
| 50-59 years | 19,294 |
| 60-69 years | 4,481 |
| 70-79 years | 771 |
| 80+ years | 304 |