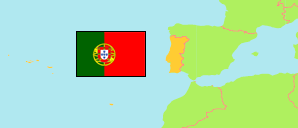
Mafra
Parish in Lisbon District
Contents: Population
The population development of Mafra as well as related information and services (Wikipedia, Google, images).
| Name | Status | Population Census 2001-03-12 | Population Census 2011-03-21 | Population Census 2021-03-22 | |
|---|---|---|---|---|---|
| Mafra | Parish | 11,276 | 17,986 | 20,781 | |
| Lisboa [Lisbon] | District | 2,136,013 | 2,250,533 | 2,275,385 |
Source: Instituto Nacional de Estatística Portugal (web).
Further information about the population structure:
| Gender (C 2021) | |
|---|---|
| Males | 10,005 |
| Females | 10,776 |
| Age Groups (C 2021) | |
|---|---|
| 0-14 years | 3,576 |
| 15-64 years | 13,917 |
| 65+ years | 3,288 |
| Age Distribution (C 2021) | |
|---|---|
| 80+ years | 878 |
| 70-79 years | 1,523 |
| 60-69 years | 1,935 |
| 50-59 years | 2,907 |
| 40-49 years | 3,991 |
| 30-39 years | 2,502 |
| 20-29 years | 2,129 |
| 10-19 years | 2,690 |
| 0-9 years | 2,226 |
| Citizenship (C 2021) | |
|---|---|
| Portugal | 19,411 |
| EU | 246 |
| Europe (other) | 103 |
| Africa | 100 |
| America | 846 |
| Asia & Oceania | 75 |
| Country of Birth (C 2021) | |
|---|---|
| Portugal | 18,108 |
| EU | 396 |
| Europe (other) | 253 |
| Africa | 777 |
| America | 1,148 |
| Asia & Oceania | 99 |