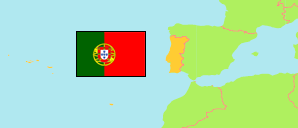
Lourinhã
Municipality in Lisbon District
Contents: Subdivision
The population development in Lourinhã as well as related information and services (Wikipedia, Google, images).
| Name | Status | Population Census 2001-03-12 | Population Census 2011-03-21 | Population Census 2021-03-22 | |
|---|---|---|---|---|---|
| Lourinhã | Municipality | 23,265 | 25,735 | 26,240 | |
| Lourinhã e Atalaia | Parish | 10,352 | 11,755 | 12,342 | → |
| Miragaia e Marteleira | Parish | 3,208 | 3,583 | 3,479 | → |
| Moita dos Ferreiros | Parish | 1,740 | 1,734 | 1,671 | → |
| Reguengo Grande | Parish | 1,562 | 1,626 | 1,486 | → |
| Ribamar | Parish | 2,080 | 2,141 | 2,160 | → |
| Santa Bárbara | Parish | 1,414 | 1,943 | 2,031 | → |
| São Bartolomeu dos Galegos e Moledo | Parish | 1,466 | 1,483 | 1,506 | → |
| Vimeiro | Parish | 1,443 | 1,470 | 1,565 | → |
| Lisboa [Lisbon] | District | 2,136,013 | 2,250,533 | 2,275,385 |
Source: Instituto Nacional de Estatística Portugal (web).
Further information about the population structure:
| Gender (C 2021) | |
|---|---|
| Males | 12,691 |
| Females | 13,549 |
| Age Groups (C 2021) | |
|---|---|
| 0-14 years | 3,516 |
| 15-64 years | 16,054 |
| 65+ years | 6,670 |
| Age Distribution (C 2021) | |
|---|---|
| 80+ years | 1,842 |
| 70-79 years | 2,952 |
| 60-69 years | 3,610 |
| 50-59 years | 3,573 |
| 40-49 years | 4,001 |
| 30-39 years | 2,911 |
| 20-29 years | 2,504 |
| 10-19 years | 2,593 |
| 0-9 years | 2,254 |
| Citizenship (C 2021) | |
|---|---|
| Portugal | 24,822 |
| EU | 317 |
| Europe (other) | 219 |
| Africa | 98 |
| America | 624 |
| Asia & Oceania | 160 |
| Country of Birth (C 2021) | |
|---|---|
| Portugal | 23,513 |
| EU | 765 |
| Europe (other) | 407 |
| Africa | 490 |
| America | 884 |
| Asia & Oceania | 181 |