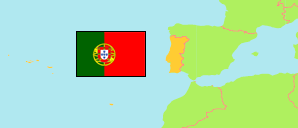
Aveiro
District in Portugal
Contents: Subdivision
The population development in Aveiro as well as related information and services (Wikipedia, Google, images).
| Name | Status | Population Census 2001-03-12 | Population Census 2011-03-21 | Population Census 2021-03-22 | |
|---|---|---|---|---|---|
| Aveiro | District | 713,575 | 714,197 | 700,787 | |
| Águeda | Municipality | 49,041 | 47,729 | 46,119 | → |
| Albergaria-a-Velha | Municipality | 24,638 | 25,252 | 24,840 | → |
| Anadia | Municipality | 31,545 | 29,150 | 27,532 | → |
| Arouca | Municipality | 24,227 | 22,359 | 21,146 | → |
| Aveiro | Municipality | 73,335 | 78,450 | 80,954 | → |
| Castelo de Paiva | Municipality | 17,338 | 16,733 | 15,586 | → |
| Espinho | Municipality | 33,701 | 31,786 | 31,043 | → |
| Estarreja | Municipality | 28,182 | 26,997 | 26,213 | → |
| Ílhavo | Municipality | 37,209 | 38,598 | 39,235 | → |
| Mealhada | Municipality | 20,751 | 20,428 | 19,348 | → |
| Murtosa | Municipality | 9,458 | 10,585 | 10,476 | → |
| Oliveira de Azeméis | Municipality | 70,721 | 68,611 | 66,175 | → |
| Oliveira do Bairro | Municipality | 21,164 | 23,028 | 23,132 | → |
| Ovar | Municipality | 55,198 | 55,398 | 54,953 | → |
| Santa Maria da Feira | Municipality | 135,964 | 139,309 | 136,674 | → |
| São João da Madeira | Municipality | 21,102 | 21,713 | 22,143 | → |
| Sever do Vouga | Municipality | 13,186 | 12,356 | 11,063 | → |
| Vagos | Municipality | 22,017 | 22,851 | 22,886 | → |
| Vale de Cambra | Municipality | 24,798 | 22,864 | 21,269 | → |
| Portugal | Republic | 10,356,117 | 10,562,178 | 10,343,066 |
Source: Instituto Nacional de Estatística Portugal (web).
Further information about the population structure:
| Gender (C 2021) | |
|---|---|
| Males | 335,788 |
| Females | 364,999 |
| Age Groups (C 2021) | |
|---|---|
| 0-14 years | 86,202 |
| 15-64 years | 451,620 |
| 65+ years | 162,965 |
| Age Distribution (C 2021) | |
|---|---|
| 80+ years | 46,650 |
| 70-79 years | 70,880 |
| 60-69 years | 95,752 |
| 50-59 years | 106,815 |
| 40-49 years | 104,930 |
| 30-39 years | 79,904 |
| 20-29 years | 74,726 |
| 10-19 years | 66,737 |
| 0-9 years | 54,393 |
| Citizenship (C 2021) | |
|---|---|
| Portugal | 680,205 |
| EU | 2,451 |
| Europe (other) | 1,738 |
| Africa | 2,476 |
| America | 12,228 |
| Asia & Oceania | 1,683 |
| Country of Birth (C 2021) | |
|---|---|
| Portugal | 642,031 |
| EU | 10,658 |
| Europe (other) | 5,320 |
| Africa | 14,154 |
| America | 26,714 |
| Asia & Oceania | 1,910 |
