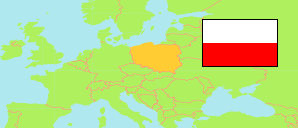
Powiat częstochowski
County in Silesia Voivodeship
Contents: Subdivision
The population development in Powiat częstochowski as well as related information and services (Wikipedia, Google, images).
| Name | Status | Population Census 2002-05-20 | Population Census 2011-03-31 | Population Census 2021-03-31 | Population Estimate 2023-12-31 | |
|---|---|---|---|---|---|---|
| Powiat częstochowski [Częstochowa County] | County | 133,749 | 136,084 | 133,175 | 131,569 | |
| Blachownia | Urban-Rural Commune | 13,331 | 13,332 | 12,724 | 12,433 | → |
| Dąbrowa Zielona | Rural Commune | 4,250 | 4,056 | 3,731 | 3,626 | → |
| Janów | Rural Commune | 6,095 | 5,975 | 5,898 | 5,845 | → |
| Kamienica Polska | Rural Commune | 5,512 | 5,577 | 5,455 | 5,373 | → |
| Kłomnice | Rural Commune | 13,888 | 13,810 | 13,133 | 12,886 | → |
| Koniecpol | Urban-Rural Commune | 10,689 | 10,173 | 8,960 | 8,651 | → |
| Konopiska | Rural Commune | 10,335 | 10,610 | 10,737 | 10,822 | → |
| Kruszyna | Rural Commune | 4,886 | 4,928 | 4,711 | 4,659 | → |
| Lelów | Rural Commune | 5,386 | 5,071 | 4,669 | 4,517 | → |
| Mstów | Rural Commune | 10,043 | 10,568 | 10,829 | 10,846 | → |
| Mykanów | Rural Commune | 13,535 | 14,557 | 15,401 | 15,345 | → |
| Olsztyn | Urban-Rural Commune | 6,998 | 7,869 | 8,179 | 8,253 | → |
| Poczesna | Rural Commune | 12,304 | 12,782 | 12,598 | 12,414 | → |
| Przyrów | Rural Commune | 4,226 | 3,972 | 3,628 | 3,539 | → |
| Rędziny | Rural Commune | 9,536 | 10,013 | 9,665 | 9,465 | → |
| Starcza | Rural Commune | 2,735 | 2,791 | 2,857 | 2,895 | → |
| Śląskie [Silesia] | Voivodeship | 4,742,874 | 4,630,364 | 4,402,950 | 4,320,130 |
Source: Główny Urząd Statystyczny, Warszawa.
Further information about the population structure:
| Gender (E 2023) | |
|---|---|
| Males | 64,566 |
| Females | 67,003 |
| Age Groups (E 2023) | |
|---|---|
| 0-17 years | 22,802 |
| 18-64 years | 81,664 |
| 65+ years | 27,103 |
| Age Distribution (E 2023) | |
|---|---|
| 80+ years | 5,318 |
| 70-79 years | 12,306 |
| 60-69 years | 18,451 |
| 50-59 years | 18,173 |
| 40-49 years | 21,526 |
| 30-39 years | 17,321 |
| 20-29 years | 13,174 |
| 10-19 years | 13,798 |
| 0-9 years | 11,502 |
| Urbanization (E 2023) | |
|---|---|
| Rural | 114,681 |
| Urban | 16,888 |
| Citizenship (C 2021) | |
|---|---|
| Poland | 133,075 |
| Other Citizenship | 99 |
| Country of Birth (C 2021) | |
|---|---|
| Poland | 131,304 |
| Other country | 1,846 |
