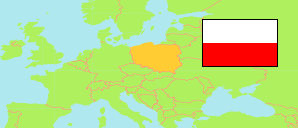
Powiat grajewski
County in Podlachia Voivodeship
Contents: Subdivision
The population development in Powiat grajewski as well as related information and services (Wikipedia, Google, images).
| Name | Status | Population Census 2002-05-20 | Population Census 2011-03-31 | Population Census 2021-03-31 | Population Estimate 2023-12-31 | |
|---|---|---|---|---|---|---|
| Powiat grajewski [Grajewo County] | County | 50,934 | 49,659 | 45,481 | 44,222 | |
| Grajewo | Urban Commune | 22,898 | 22,521 | 21,395 | 20,899 | → |
| Grajewo (gm.w.) | Rural Commune | 6,168 | 6,069 | 5,543 | 5,450 | → |
| Radziłów | Rural Commune | 5,305 | 5,070 | 4,470 | 4,295 | → |
| Rajgród | Urban-Rural Commune | 5,679 | 5,526 | 4,767 | 4,579 | → |
| Szczuczyn | Urban-Rural Commune | 6,801 | 6,502 | 5,889 | 5,704 | → |
| Wąsosz | Rural Commune | 4,083 | 3,971 | 3,417 | 3,295 | → |
| Podlaskie [Podlachia] | Voivodeship | 1,208,606 | 1,202,365 | 1,154,283 | 1,138,216 |
Source: Główny Urząd Statystyczny, Warszawa.
Further information about the population structure:
| Gender (E 2023) | |
|---|---|
| Males | 21,819 |
| Females | 22,403 |
| Age Groups (E 2023) | |
|---|---|
| 0-17 years | 7,766 |
| 18-64 years | 27,896 |
| 65+ years | 8,560 |
| Age Distribution (E 2023) | |
|---|---|
| 80+ years | 1,892 |
| 70-79 years | 3,657 |
| 60-69 years | 6,098 |
| 50-59 years | 6,098 |
| 40-49 years | 6,635 |
| 30-39 years | 6,078 |
| 20-29 years | 5,017 |
| 10-19 years | 4,736 |
| 0-9 years | 4,011 |
| Urbanization (E 2023) | |
|---|---|
| Rural | 18,796 |
| Urban | 25,426 |
| Citizenship (C 2021) | |
|---|---|
| Poland | 45,450 |
| Other Citizenship | 31 |
| Country of Birth (C 2021) | |
|---|---|
| Poland | 44,382 |
| Other country | 1,077 |