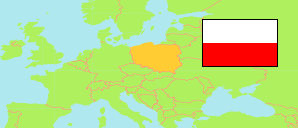
Krzywcza
Rural Commune in Subcarpathia Voivodeship
Contents: Population
The population development of Krzywcza as well as related information and services (Wikipedia, Google, images).
| Name | Status | Population Census 2002-05-20 | Population Census 2011-03-31 | Population Census 2021-03-31 | Population Estimate 2023-12-31 | |
|---|---|---|---|---|---|---|
| Krzywcza | Rural Commune | 5,026 | 4,933 | 4,590 | 4,497 | |
| Podkarpackie [Subcarpathia] | Voivodeship | 2,095,515 | 2,127,285 | 2,093,360 | 2,071,676 |
Source: Główny Urząd Statystyczny, Warszawa.
Further information about the population structure:
| Gender (E 2023) | |
|---|---|
| Males | 2,354 |
| Females | 2,143 |
| Age Groups (E 2023) | |
|---|---|
| 0-17 years | 854 |
| 18-64 years | 2,840 |
| 65+ years | 803 |
| Age Distribution (E 2023) | |
|---|---|
| 80+ years | 183 |
| 70-79 years | 354 |
| 60-69 years | 569 |
| 50-59 years | 586 |
| 40-49 years | 677 |
| 30-39 years | 659 |
| 20-29 years | 542 |
| 10-19 years | 470 |
| 0-9 years | 457 |
| Urbanization (E 2023) | |
|---|---|
| Rural | 4,497 |
| Citizenship (C 2021) | |
|---|---|
| Poland | 4,584 |
| Other Citizenship | 6 |
| Country of Birth (C 2021) | |
|---|---|
| Poland | 4,504 |
| Other country | 85 |
