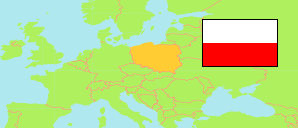
Powiat krośnieński
County in Subcarpathia Voivodeship
Contents: Subdivision
The population development in Powiat krośnieński as well as related information and services (Wikipedia, Google, images).
| Name | Status | Population Census 2002-05-20 | Population Census 2011-03-31 | Population Census 2021-03-31 | Population Estimate 2023-12-31 | |
|---|---|---|---|---|---|---|
| Powiat krośnieński [Krosno County] | County | 108,880 | 111,681 | 110,042 | 108,659 | |
| Chorkówka | Rural Commune | 12,954 | 13,477 | 13,507 | 13,469 | → |
| Dukla | Urban-Rural Commune | 16,733 | 14,855 | 14,099 | 13,847 | → |
| Iwonicz-Zdrój | Urban-Rural Commune | 10,723 | 10,919 | 10,486 | 10,223 | → |
| Jaśliska | Rural Commune | ... | 2,100 | 2,098 | 2,072 | → |
| Jedlicze | Urban-Rural Commune | 14,963 | 15,469 | 15,063 | 14,910 | → |
| Korczyna | Rural Commune | 10,639 | 11,003 | 11,182 | 11,098 | → |
| Krościenko Wyżne | Rural Commune | 5,016 | 5,426 | 5,428 | 5,347 | → |
| Miejsce Piastowe | Rural Commune | 13,227 | 13,554 | 13,418 | 13,301 | → |
| Rymanów | Urban-Rural Commune | 15,548 | 15,682 | 15,515 | 15,202 | → |
| Wojaszówka | Rural Commune | 9,077 | 9,196 | 9,246 | 9,190 | → |
| Podkarpackie [Subcarpathia] | Voivodeship | 2,095,515 | 2,127,285 | 2,093,360 | 2,071,676 |
Source: Główny Urząd Statystyczny, Warszawa.
Further information about the population structure:
| Gender (E 2023) | |
|---|---|
| Males | 53,522 |
| Females | 55,137 |
| Age Groups (E 2023) | |
|---|---|
| 0-17 years | 20,780 |
| 18-64 years | 67,394 |
| 65+ years | 20,485 |
| Age Distribution (E 2023) | |
|---|---|
| 80+ years | 4,660 |
| 70-79 years | 9,091 |
| 60-69 years | 13,755 |
| 50-59 years | 14,202 |
| 40-49 years | 16,935 |
| 30-39 years | 15,011 |
| 20-29 years | 11,997 |
| 10-19 years | 12,583 |
| 0-9 years | 10,425 |
| Urbanization (E 2023) | |
|---|---|
| Rural | 96,073 |
| Urban | 12,586 |
| Citizenship (C 2021) | |
|---|---|
| Poland | 109,975 |
| Other Citizenship | 67 |
| Country of Birth (C 2021) | |
|---|---|
| Poland | 107,808 |
| Other country | 2,203 |
