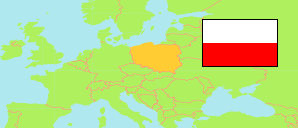
Powiat płocki
County in Mazovia Voivodeship
Contents: Subdivision
The population development in Powiat płocki as well as related information and services (Wikipedia, Google, images).
| Name | Status | Population Census 2002-05-20 | Population Census 2011-03-31 | Population Census 2021-03-31 | Population Estimate 2023-12-31 | |
|---|---|---|---|---|---|---|
| Powiat płocki [Płock County] | County | 105,045 | 110,140 | 110,045 | 109,531 | |
| Bielsk | Rural Commune | 8,896 | 9,141 | 8,954 | 8,873 | → |
| Bodzanów | Urban-Rural Commune | 8,388 | 8,417 | 7,934 | 7,751 | → |
| Brudzeń Duży | Rural Commune | 7,756 | 8,124 | 8,264 | 8,251 | → |
| Bulkowo | Rural Commune | 6,080 | 5,852 | 5,291 | 5,193 | → |
| Drobin | Urban-Rural Commune | 8,732 | 8,462 | 7,490 | 7,289 | → |
| Gąbin | Urban-Rural Commune | 10,753 | 10,975 | 11,076 | 11,151 | → |
| Łąck | Rural Commune | 4,817 | 5,198 | 5,376 | 5,364 | → |
| Mała Wieś | Rural Commune | 6,508 | 6,275 | 5,755 | 5,631 | → |
| Nowy Duninów | Rural Commune | 3,922 | 3,993 | 3,982 | 3,934 | → |
| Radzanowo | Rural Commune | 7,003 | 8,030 | 8,590 | 8,705 | → |
| Słubice | Rural Commune | 4,643 | 4,622 | 4,201 | 4,118 | → |
| Słupno | Rural Commune | 4,474 | 6,596 | 8,732 | 9,051 | → |
| Stara Biała | Rural Commune | 9,229 | 10,986 | 12,184 | 12,265 | → |
| Staroźreby | Rural Commune | 7,645 | 7,580 | 6,888 | 6,767 | → |
| Wyszogród | Urban-Rural Commune | 6,199 | 5,889 | 5,328 | 5,188 | → |
| Mazowieckie [Mazovia] | Voivodeship | 5,124,018 | 5,268,660 | 5,514,699 | 5,510,527 |
Source: Główny Urząd Statystyczny, Warszawa.
Further information about the population structure:
| Gender (E 2023) | |
|---|---|
| Males | 54,404 |
| Females | 55,127 |
| Age Groups (E 2023) | |
|---|---|
| 0-17 years | 21,037 |
| 18-64 years | 69,158 |
| 65+ years | 19,336 |
| Age Distribution (E 2023) | |
|---|---|
| 80+ years | 4,012 |
| 70-79 years | 8,788 |
| 60-69 years | 13,338 |
| 50-59 years | 15,136 |
| 40-49 years | 17,542 |
| 30-39 years | 14,881 |
| 20-29 years | 12,279 |
| 10-19 years | 12,958 |
| 0-9 years | 10,597 |
| Urbanization (E 2023) | |
|---|---|
| Rural | 99,255 |
| Urban | 10,276 |
| Citizenship (C 2021) | |
|---|---|
| Poland | 109,960 |
| Other Citizenship | 85 |
| Country of Birth (C 2021) | |
|---|---|
| Poland | 109,182 |
| Other country | 828 |
