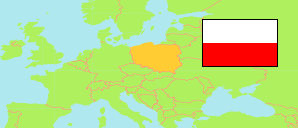
Grabica
Rural Commune in Łódź Voivodeship
Contents: Population
The population development of Grabica as well as related information and services (Wikipedia, Google, images).
| Name | Status | Population Census 2002-05-20 | Population Census 2011-03-31 | Population Census 2021-03-31 | |
|---|---|---|---|---|---|
| Grabica | Rural Commune | 6,167 | 6,101 | 6,030 | |
| Łódzkie [Łódź] | Voivodeship | 2,612,890 | 2,538,677 | 2,410,286 |
Source: Główny Urząd Statystyczny, Warszawa (web).
Further information about the population structure:
| Gender (C 2021) | |
|---|---|
| Males | 3,013 |
| Females | 3,017 |
| Age Groups (C 2021) | |
|---|---|
| 0-17 years | 1,295 |
| 18-64 years | 3,736 |
| 65+ years | 999 |
| Age Distribution (C 2021) | |
|---|---|
| 90+ years | 39 |
| 80-89 years | 201 |
| 70-79 years | 418 |
| 60-69 years | 741 |
| 50-59 years | 693 |
| 40-49 years | 898 |
| 30-39 years | 899 |
| 20-29 years | 730 |
| 10-19 years | 668 |
| 0-9 years | 743 |
| Urbanization (C 2021) | |
|---|---|
| Rural | 6,030 |