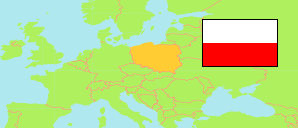
Powiat leżajski
County in Poland
Contents: Population
The population development of Powiat leżajski as well as related information and services (Wikipedia, Google, images).
| Name | Status | Population Census 2002-05-20 | Population Census 2011-03-31 | Population Census 2021-03-31 | Population Estimate 2023-12-31 | |
|---|---|---|---|---|---|---|
| Powiat leżajski [Leżajsk County] | County | 69,134 | 70,152 | 67,767 | 66,698 | |
| Polska [Poland] | Republic | 38,230,080 | 38,511,824 | 38,036,118 | 37,636,508 |
Source: Główny Urząd Statystyczny, Warszawa.
Further information about the population structure:
| Gender (E 2023) | |
|---|---|
| Males | 32,889 |
| Females | 33,809 |
| Age Groups (E 2023) | |
|---|---|
| 0-17 years | 12,224 |
| 18-64 years | 42,088 |
| 65+ years | 12,386 |
| Age Distribution (E 2023) | |
|---|---|
| 80+ years | 2,697 |
| 70-79 years | 5,576 |
| 60-69 years | 8,432 |
| 50-59 years | 8,821 |
| 40-49 years | 10,154 |
| 30-39 years | 9,580 |
| 20-29 years | 7,840 |
| 10-19 years | 7,332 |
| 0-9 years | 6,266 |
| Urbanization (E 2023) | |
|---|---|
| Rural | 48,644 |
| Urban | 18,054 |
| Citizenship (C 2021) | |
|---|---|
| Poland | 67,739 |
| Other Citizenship | 28 |
| Country of Birth (C 2021) | |
|---|---|
| Poland | 66,055 |
| Other country | 1,686 |
